OPEN-SOURCE SCRIPT
UCS_S_Steve Primo - Strategy 3
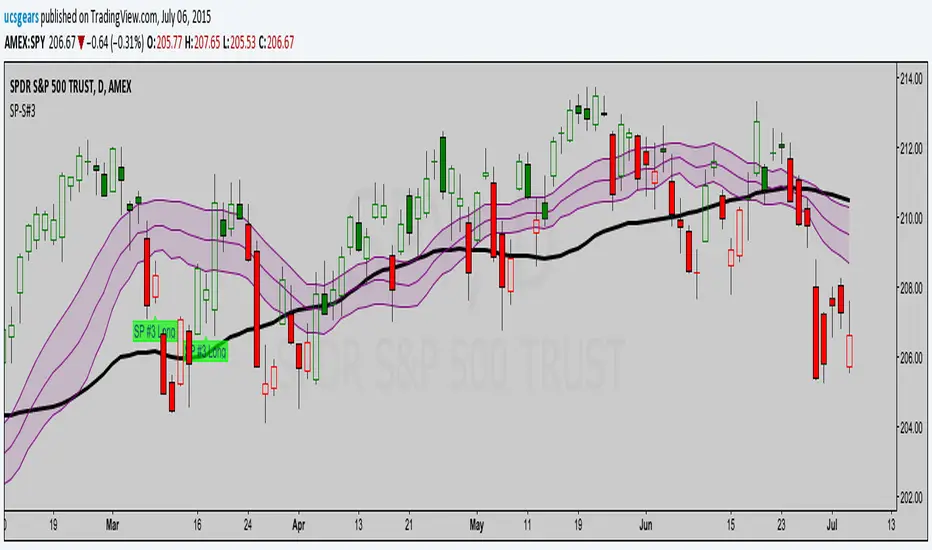
Here is the code for Steve Primo Strategy #1 - Setup Long and Short
- Please refer to his videos for triggers and management.
Share your views.
- Please refer to his videos for triggers and management.
Share your views.
Skrypt open-source
W zgodzie z duchem TradingView twórca tego skryptu udostępnił go jako open-source, aby użytkownicy mogli przejrzeć i zweryfikować jego działanie. Ukłony dla autora. Korzystanie jest bezpłatne, jednak ponowna publikacja kodu podlega naszym Zasadom serwisu.
Uday C Santhakumar
udaycs.substack.com/
udaycs.substack.com/
Wyłączenie odpowiedzialności
Informacje i publikacje nie stanowią i nie powinny być traktowane jako porady finansowe, inwestycyjne, tradingowe ani jakiekolwiek inne rekomendacje dostarczane lub zatwierdzone przez TradingView. Więcej informacji znajduje się w Warunkach użytkowania.