OPEN-SOURCE SCRIPT
Zaktualizowano Highest Price Marker
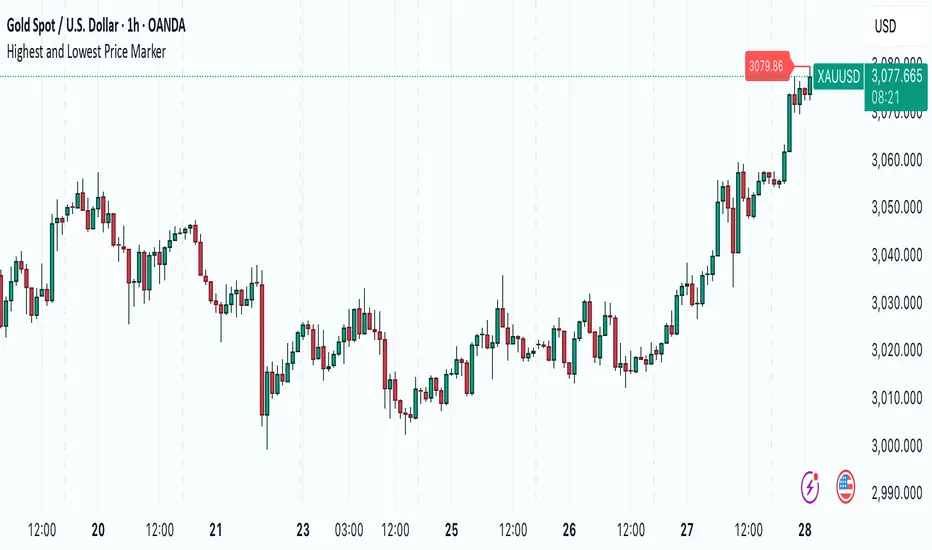
Highest Price Marker – Smart Label & Line Indicator
This Pine Script v5 indicator highlights the highest price reached within the last 100 bars on your chart. It visually enhances key price levels by:
✅ Placing a label at the highest price, positioned 3 candles to the left for clarity.
✅ Drawing a line connecting the label to the actual high for better visibility.
✅ Auto-updating dynamically whenever a new highest price is detected.
This is useful for traders who want to quickly identify resistance levels or analyze historical price peaks without cluttering the chart.
🔹 How to Use:
Add the indicator to your chart.
Look for the red label marking the highest price within the last 100 bars.
The horizontal line helps track the exact price level.
💡 Customization Ideas:
Adjust the lookback period (length = 100) to detect longer or shorter trends.
Modify colors or label positioning to suit your preferences.
🚀 Perfect for:
🔸 Price Action Traders
🔸 Swing & Breakout Traders
🔸 Support & Resistance Analysis
Informacje o Wersji
This indicator scans the past 100 bars to pinpoint the most extreme price levels, marking the highest and lowest values on your chart. It adds dynamic labels and connecting lines that visually capture these key price points, providing you with a clear reference of where significant price movements have occurred over your chosen period.By displaying these price markers in real time, the tool gives you an intuitive snapshot of market extremes, enabling you to better monitor sudden shifts and evaluate market sentiment. Whether you're tracking intraday volatility or analyzing longer-term trends, this indicator serves as a practical guide to the price action that matters most.
Skrypt open-source
W zgodzie z duchem TradingView twórca tego skryptu udostępnił go jako open-source, aby użytkownicy mogli przejrzeć i zweryfikować jego działanie. Ukłony dla autora. Korzystanie jest bezpłatne, jednak ponowna publikacja kodu podlega naszym Zasadom serwisu.
Wyłączenie odpowiedzialności
Informacje i publikacje nie stanowią i nie powinny być traktowane jako porady finansowe, inwestycyjne, tradingowe ani jakiekolwiek inne rekomendacje dostarczane lub zatwierdzone przez TradingView. Więcej informacji znajduje się w Warunkach użytkowania.