OPEN-SOURCE SCRIPT
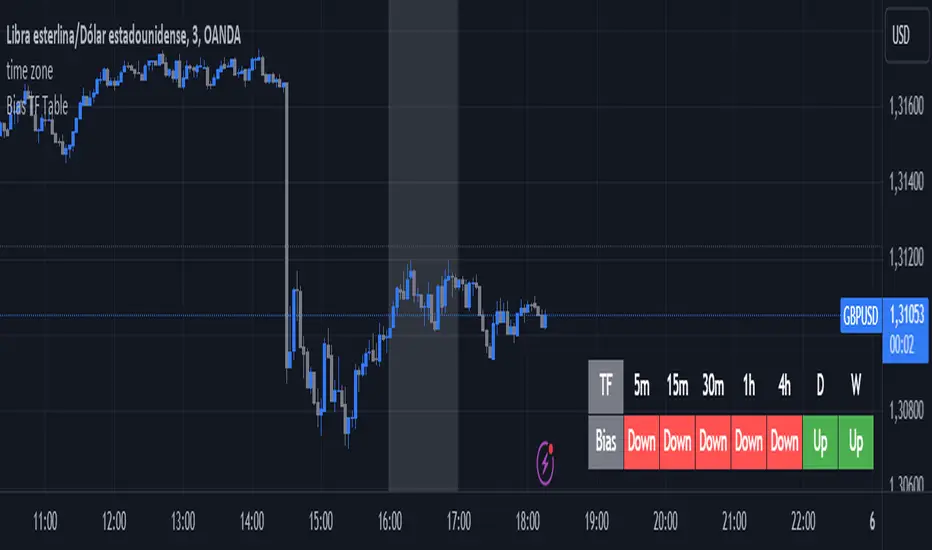
Bias TF Table

This indicator is a technical analysis tool designed to evaluate the price trend of an asset across multiple time frames (5 minutes, 15 minutes, 30 minutes, 1 hour, 4 hours, daily, and weekly).
Main Functions:
Directional Bias: Displays whether the trend is bullish (Up) or bearish (Down) for each time frame, using the closing price in comparison to a 50-period exponential moving average (EMA).
Table Visualization: Presents the results in a table located in the bottom right corner of the chart, making it easy to read and compare trends across different time intervals.
This indicator provides a quick and effective way to assess market direction and make informed trading decisions based on the trend in various time frames.
Skrypt open-source
W zgodzie z duchem TradingView twórca tego skryptu udostępnił go jako open-source, aby użytkownicy mogli przejrzeć i zweryfikować jego działanie. Ukłony dla autora. Korzystanie jest bezpłatne, jednak ponowna publikacja kodu podlega naszym Zasadom serwisu.
Wyłączenie odpowiedzialności
Informacje i publikacje nie stanowią i nie powinny być traktowane jako porady finansowe, inwestycyjne, tradingowe ani jakiekolwiek inne rekomendacje dostarczane lub zatwierdzone przez TradingView. Więcej informacji znajduje się w Warunkach użytkowania.