OPEN-SOURCE SCRIPT
Zaktualizowano Multi‑Timeframe RSIOMA Dashboard
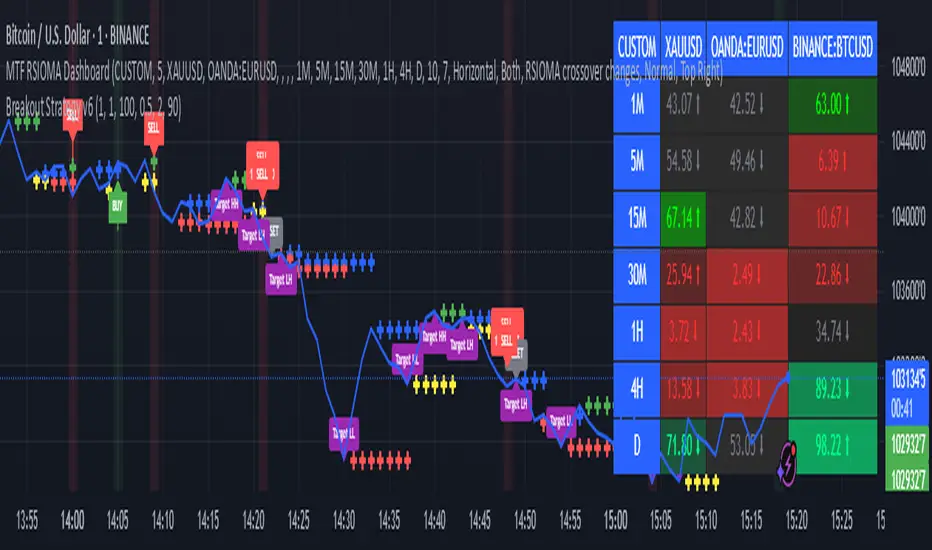
The Multi-Timeframe RSIOMA Dashboard is a TradingView tool that displays RSIOMA (Relative Strength Index Over Moving Average) values for up to 10 symbols across multiple timeframes in a color-coded table. It helps traders spot bullish (>50, green) or bearish (<50, red) momentum, with optional MA smoothing for clearer trends. Customize symbols, timeframes, and settings to track market strength at a glanc
Informacje o Wersji
UPDATE Informacje o Wersji
UPDATEInformacje o Wersji
UPDATEInformacje o Wersji
update Informacje o Wersji
updateInformacje o Wersji
UPDATEInformacje o Wersji
updateInformacje o Wersji
UPDATEInformacje o Wersji
update Informacje o Wersji
UPDATE Skrypt open-source
W zgodzie z duchem TradingView twórca tego skryptu udostępnił go jako open-source, aby użytkownicy mogli przejrzeć i zweryfikować jego działanie. Ukłony dla autora. Korzystanie jest bezpłatne, jednak ponowna publikacja kodu podlega naszym Zasadom serwisu.
Wyłączenie odpowiedzialności
Informacje i publikacje nie stanowią i nie powinny być traktowane jako porady finansowe, inwestycyjne, tradingowe ani jakiekolwiek inne rekomendacje dostarczane lub zatwierdzone przez TradingView. Więcej informacji znajduje się w Warunkach użytkowania.
Skrypt open-source
W zgodzie z duchem TradingView twórca tego skryptu udostępnił go jako open-source, aby użytkownicy mogli przejrzeć i zweryfikować jego działanie. Ukłony dla autora. Korzystanie jest bezpłatne, jednak ponowna publikacja kodu podlega naszym Zasadom serwisu.
Wyłączenie odpowiedzialności
Informacje i publikacje nie stanowią i nie powinny być traktowane jako porady finansowe, inwestycyjne, tradingowe ani jakiekolwiek inne rekomendacje dostarczane lub zatwierdzone przez TradingView. Więcej informacji znajduje się w Warunkach użytkowania.