OPEN-SOURCE SCRIPT
Solana – Daily Chart Analysis
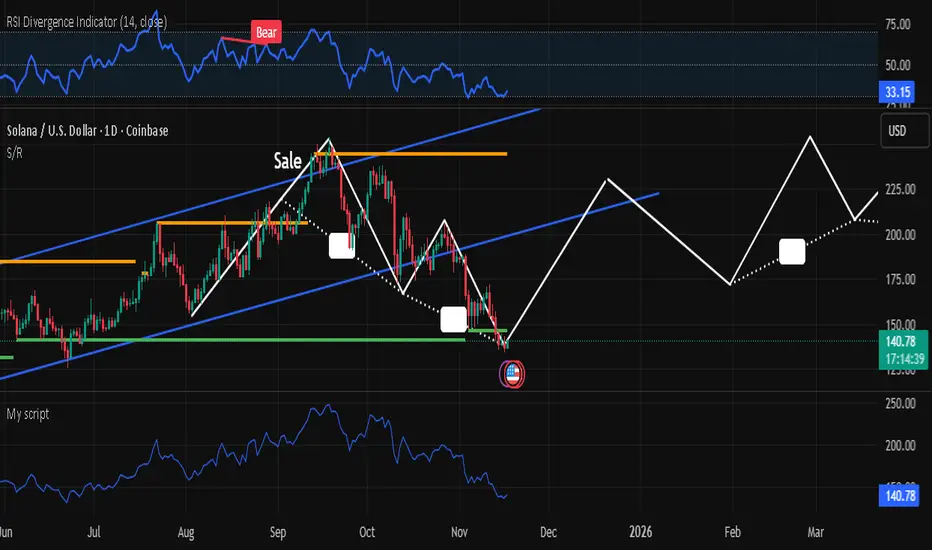
Solana is currently holding around $140 after a sharp correction from the upper channel resistance. Price is testing a key ascending trendline and horizontal support zone near $135.
📉 RSI at 32.76 signals oversold conditions, watch for potential bullish reversal setups.
🔮 Possible Path Ahead (White Projection):
• Bounce to $180 → Consolidation
• Breakout toward $240
• Target zone: $280–$300 by mid-2026
(based on channel re-entry and momentum recovery)
❗If support fails, next major demand zone sits around $100–$110.
📊 Watching closely for confirmation of trend reversal.
Skrypt open-source
W zgodzie z duchem TradingView twórca tego skryptu udostępnił go jako open-source, aby użytkownicy mogli przejrzeć i zweryfikować jego działanie. Ukłony dla autora. Korzystanie jest bezpłatne, jednak ponowna publikacja kodu podlega naszym Zasadom serwisu.
Wyłączenie odpowiedzialności
Informacje i publikacje nie stanowią i nie powinny być traktowane jako porady finansowe, inwestycyjne, tradingowe ani jakiekolwiek inne rekomendacje dostarczane lub zatwierdzone przez TradingView. Więcej informacji znajduje się w Warunkach użytkowania.