OPEN-SOURCE SCRIPT
ACD PMA
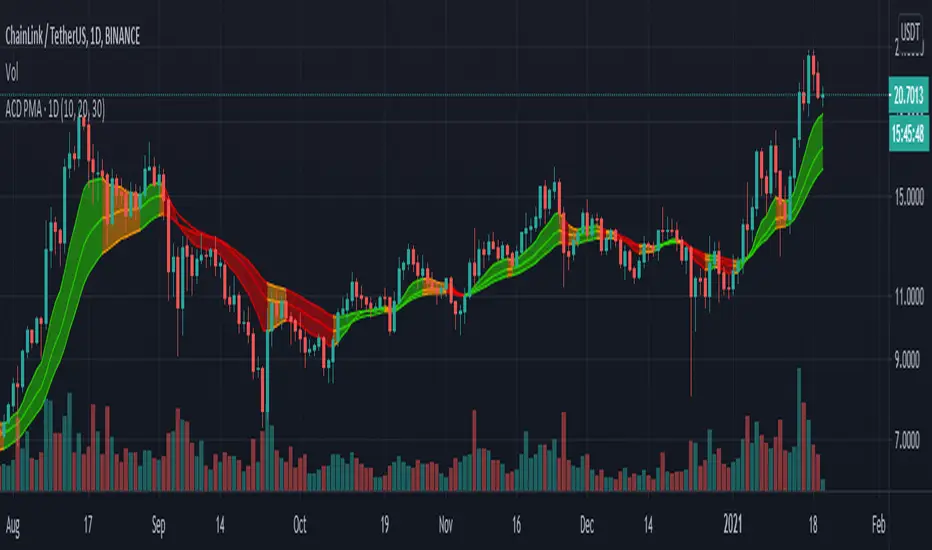
PMA (Pivot Moving average) is a set of 3 EMAs on HLC3 data.
When all PMAs are rising, market is considered bullish and the color of PMA becomes green. When all PMAs are falling, market is considered bearish and the color of the PMA becomes red. Otherwise, market is considered ranging and the color becomes orange.
It's also possible to set the resolution of PMAs. For example, you can see daily PMA of 15min charts. This way, if resolution of PMA is greater than resolution of chart, a vertical line shows the beginning of the PMA's resolution candles.
These PMAs are important components of Mark Fisher's ACD strategy.
Skrypt open-source
W zgodzie z duchem TradingView twórca tego skryptu udostępnił go jako open-source, aby użytkownicy mogli przejrzeć i zweryfikować jego działanie. Ukłony dla autora. Korzystanie jest bezpłatne, jednak ponowna publikacja kodu podlega naszym Zasadom serwisu.
Wyłączenie odpowiedzialności
Informacje i publikacje nie stanowią i nie powinny być traktowane jako porady finansowe, inwestycyjne, tradingowe ani jakiekolwiek inne rekomendacje dostarczane lub zatwierdzone przez TradingView. Więcej informacji znajduje się w Warunkach użytkowania.