OPEN-SOURCE SCRIPT
Zaktualizowano Parabolic sar with breaks
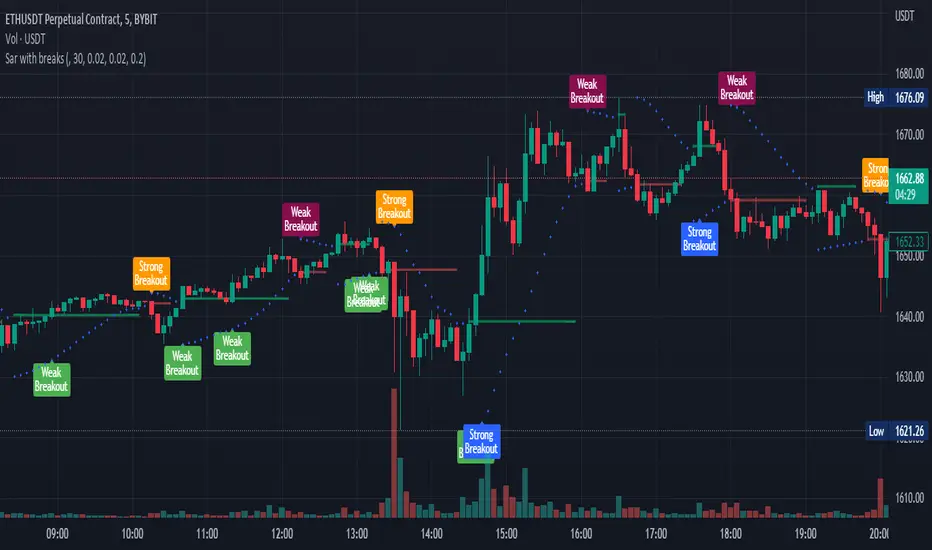
This plots a Parabolic sar and a break line on the previous sar point before the parabolic sar flips.
This is looking to be a very popular entry signal for lots of strats.
How to use:
In conjunction with other confirmation indicators;
Long: Enter long when the Parabolic sar is below the price and the price breaks above (and closes) the break line.
Short: Enter short when the Parabolic sar is above the price and the price breaks below (and closes) the break line.
A great indicator combination for this is to use a 200 ema for price trend and volume flow.
Informacje o Wersji
Added long and short labels that show when the psar line is broken with high volumeInformacje o Wersji
Changed chartAdded check that labels should not show if the breaking candle has a long wick
Informacje o Wersji
removed wick check as it was buggyInformacje o Wersji
Only show signals when parabolic sar is bullish/bearish.Informacje o Wersji
Selectable timeframeInformacje o Wersji
Added alerts and changed breakout labels.After some research, I have found that when a parabolic Sar Breakout line is broken by price with high volume, it is much more likely to continue in that direction, and so I have have added strong and weak breakout labels.
You are able to show/hide them individually.
Skrypt open-source
W zgodzie z duchem TradingView twórca tego skryptu udostępnił go jako open-source, aby użytkownicy mogli przejrzeć i zweryfikować jego działanie. Ukłony dla autora. Korzystanie jest bezpłatne, jednak ponowna publikacja kodu podlega naszym Zasadom serwisu.
Wyłączenie odpowiedzialności
Informacje i publikacje nie stanowią i nie powinny być traktowane jako porady finansowe, inwestycyjne, tradingowe ani jakiekolwiek inne rekomendacje dostarczane lub zatwierdzone przez TradingView. Więcej informacji znajduje się w Warunkach użytkowania.