OPEN-SOURCE SCRIPT
Zaktualizowano Multi-timeframe Difference Forecast (MTD)
Description:
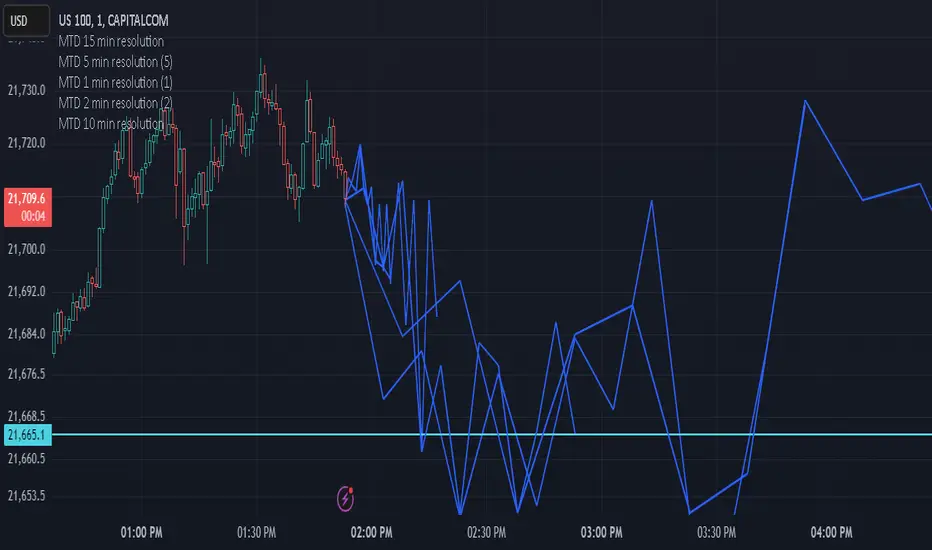
The Multi-timeframe Difference Forecast indicator projects potential future price levels by comparing open prices across multiple timeframe pairs. It uses 12 predefined timeframe pairs where each pair consists of a lower and a higher timeframe. For each pair, the indicator calculates a forecast value by adding the difference between the lower timeframe’s open and the higher timeframe’s open to the current bar’s close. These forecast values are then plotted as points into the future and connected by blue line segments, forming a continuous projection line on your chart.
How It Works:
Timeframe Pairs:
The indicator defines 12 pairs. For example:
Pair 1: Lower timeframe = 15 minutes; Higher timeframe = 150 minutes
Pair 2: Lower timeframe = 30 minutes; Higher timeframe = 165 minutes
⋮
Pair 12: Lower timeframe = 180 minutes; Higher timeframe = 720 minutes
Forecast Calculation:
For each pair, the forecast is computed as:
forecast = close + (lower timeframe open - higher timeframe open)
This produces a series of forecast values that are then plotted on the chart.
Time Offset:
Each forecast point is offset into the future by a number of bars calculated as the ratio between the lower timeframe’s duration (in seconds) and the current chart’s timeframe (in seconds). This adjustment helps align the forecast points correctly on the time axis.
Visualization:
The indicator draws blue lines (width = 2) connecting the current price to each forecast point sequentially, forming a polyline that visually represents the projected price trajectory.
How to Use:
Overlay on Chart:
Apply this indicator to any chart, and it will automatically overlay the forecast line on your current price chart.
Timeframe Flexibility:
The calculations adjust to the chart’s timeframe, so you can use it on various timeframes without needing to change the code.
Interpretation:
The forecast line is intended to provide a visual estimate of potential future price movement based on historical open price differences. It is meant to serve as an additional analytical tool rather than a standalone trading signal.
Disclaimer:
This script is provided for educational and informational purposes only and should not be construed as financial or trading advice. Trading involves significant risk, and past performance is not indicative of future results. You should perform your own analysis and consult with a qualified professional before making any trading decisions. Use this indicator at your own risk.
Informacje o Wersji
This indicator uses a multi-timeframe approach to forecast future price levels. It does so by calculating a series of forecast points based on 12 preset pairs of timeframes. For each pair, the indicator retrieves the open price from two different resolutions—a “lower” and a “higher” timeframe—and uses their difference (with the order intentionally flipped) to project a forecasted price. The resulting forecast points are then connected by blue line segments to create a continuous forecast polyline.How It Works
Defining Timeframe Pairs:
The script predefines 12 pairs of timeframes. For example:
Pair 1: Lower timeframe = 10 minutes; Higher timeframe = 100 minutes
Pair 2: Lower timeframe = 20 minutes; Higher timeframe = 110 minutes
… and so on, up to Pair 12 (with lower timeframe = 120 minutes and higher timeframe = 480 minutes).
Retrieving Prices Across Timeframes:
For each pair, the indicator uses the request.security function to retrieve the open prices for both the lower and higher timeframe. These values are obtained using lookahead=barmerge.lookahead_on so that the price data is aligned properly on the current chart.
Forecast Calculation (with a Flipped Difference):
Traditionally, one might expect to subtract the higher timeframe’s open from the lower timeframe’s open. However, in this indicator the calculation is flipped:
forecast
=
current close
+
(
higher timeframe open
−
lower timeframe open
)
forecast=current close+(higher timeframe open−lower timeframe open)
This means that for each pair, the difference is added to the current close price to produce a forecast value.
Determining the X-Axis Offset:
The indicator calculates an offset (in bars) for each forecast point. This offset is based on the ratio of the lower timeframe’s duration (converted to seconds) to the current chart’s timeframe (also in seconds). The offset determines how far in the future (in terms of bar index) each forecast point should be placed.
Plotting the Forecast Polyline:
Forecast Points:
Point 0: Represents the current bar’s close.
Points 1–12: Each is plotted at an x-coordinate shifted by its computed offset and at a y-coordinate given by the forecast value.
Line Segments:
The script creates persistent line objects (using var line) to draw segments connecting these points. On the last bar, each segment is updated so that the polyline connects from the current price (Point 0) through each forecasted point (Points 1–12) in sequence.
Visuals:
All line segments are drawn in blue with a width of 2.
Special Note on Calculation
Important: In the calculation of the forecast values, the usual subtraction order (lower timeframe minus higher timeframe) has been intentionally flipped. In this script, the forecast is computed as:
forecast
=
current close
+
(
higher timeframe open
−
lower timeframe open
)
forecast=current close+(higher timeframe open−lower timeframe open)
This reversed calculation is a deliberate design choice in this indicator’s methodology.
Usage and Disclaimer
Purpose: This indicator is intended for use as an analytical tool to forecast potential future price levels based on multi-timeframe dynamics. It is not a trading signal generator and should not be used as the sole basis for any trading decisions.
Educational Use: The script is provided for educational and informational purposes only. Users should perform their own analysis and testing before applying any forecasts to live trading.
No Warranty: The creator assumes no responsibility for losses incurred by using this indicator.
Skrypt open-source
W zgodzie z duchem TradingView twórca tego skryptu udostępnił go jako open-source, aby użytkownicy mogli przejrzeć i zweryfikować jego działanie. Ukłony dla autora. Korzystanie jest bezpłatne, jednak ponowna publikacja kodu podlega naszym Zasadom serwisu.
Wyłączenie odpowiedzialności
Informacje i publikacje nie stanowią i nie powinny być traktowane jako porady finansowe, inwestycyjne, tradingowe ani jakiekolwiek inne rekomendacje dostarczane lub zatwierdzone przez TradingView. Więcej informacji znajduje się w Warunkach użytkowania.