PROTECTED SOURCE SCRIPT
Triple EMA + RSI candles
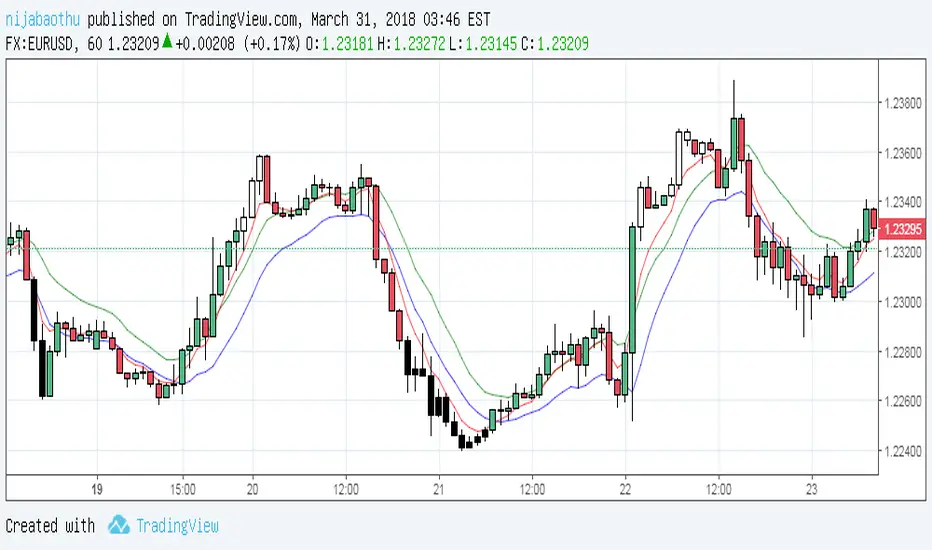
Using EMA5 ( Exponential Moving Average ) as the main trend of price, the intersection with EMA10 will signal the point of entry (go long, go short) reasonable. At this point, I pushed the EMA10 at high price to sell sooner and at low price to buy early. More specific:
- When the red line crosses the blue line, the signal is the Buy.
- When the red line cut the green line, the signal is Sell.
Efficient with short trading tactics.
Notes: Combined with pinbar signs and practal indicators will yield better results.
This is a new update with specific signals. Clearly, when the red line cut down the green line with a white candle, you had a sell signal for a few candles after. At the back side,...
Skrypt chroniony
Ten skrypt został opublikowany jako zamknięty kod źródłowy. Można z tego korzystać swobodnie i bez żadnych ograniczeń — więcej informacji znajduje się tutaj.
Wyłączenie odpowiedzialności
Informacje i publikacje nie stanowią i nie powinny być traktowane jako porady finansowe, inwestycyjne, tradingowe ani jakiekolwiek inne rekomendacje dostarczane lub zatwierdzone przez TradingView. Więcej informacji znajduje się w Warunkach użytkowania.