Z Momentum
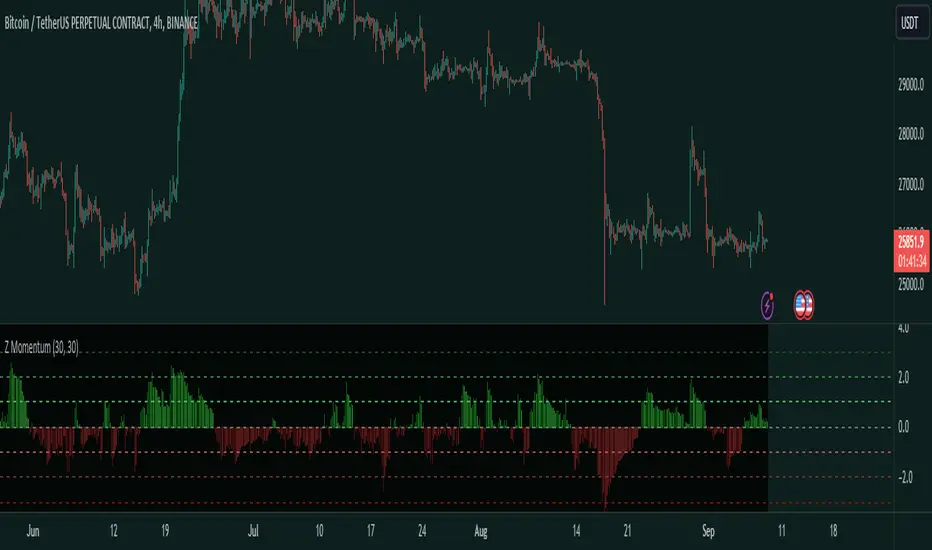
This is a Z-Scored Momentum Indicator. It allows you to understand the volatility of a financial instrument. This indicator calculates and displays the momentum of z-score returns expected value which can be used for finding the regime or for trading inefficiencies.
Indicator Purpose:
The primary purpose of the "Z-Score Momentum" indicator is to help traders identify potential trading opportunities by assessing how far the current returns of a financial instrument deviate from their historical mean returns. This analysis can aid in recognizing overbought or oversold conditions, trend strength, and potential reversal points.
Things to note:[\b]
A Z-Score is a measure of how many standard deviations a data point is away from the mean.
EV: Expected Value, which is basically the average outcome.
When the Z-Score Momentum is above 0, there is a positive Z-Score which indicates that the current returns of the financial instrument are above their historical mean returns over the specified return lookback period, which could mean Positive, Momentum, and in a extremely high Z-Score value, like above +2 Standard deviations it could indicate extreme conditions, but keep in mind this doesn't mean price will go down, this is just the EV.
When the Z-Score Momentum is below 0, there is negative Z-Score which indicates that the current returns of the financial instrument are below their historical mean returns which means you could expect negative returns. In extreme Z-Score situations like -2 Standard deviations this could indicate extreme conditions and the negative momentum is coming to an end.
TDLR:
Interpretation:
- Positive Z-Score: When the Z-score is positive and increasing, it suggests that current returns are above their historical mean, indicating potential positive momentum.
- Negative Z-Score: Conversely, a negative and decreasing Z-score implies that current returns are below their historical mean, suggesting potential negative momentum.
- Extremely High or Low Z-Score: Extremely high (above +2) or low (below -2) Z-scores may indicate extreme market conditions that could be followed by reversals or significant price movements.
The lines on the Indicator highlight the Standard deviations of the Z-Score. It shows the Standard deviations 1,2,3 and -1,-2,-3.
Skrypt tylko na zaproszenie
Tylko użytkownicy zatwierdzeni przez autora mogą uzyskać dostęp do tego skryptu. Musisz złożyć prośbę i uzyskać zgodę na jego użycie. Zazwyczaj jest ona udzielana po dokonaniu płatności. Aby uzyskać więcej informacji, postępuj zgodnie z instrukcjami autora poniżej lub skontaktuj się bezpośrednio z Traders_Endeavors.
TradingView NIE zaleca płacenia za skrypt ani jego używania, jeśli nie masz pełnego zaufania do jego autora i nie rozumiesz, jak działa. Możesz także znaleźć darmowe, open-source'owe alternatywy w naszej sekcji skryptów społecznościowych.
Instrukcje autora
Access our indicators: patreon.com/user?u=80987417
Wyłączenie odpowiedzialności
Skrypt tylko na zaproszenie
Tylko użytkownicy zatwierdzeni przez autora mogą uzyskać dostęp do tego skryptu. Musisz złożyć prośbę i uzyskać zgodę na jego użycie. Zazwyczaj jest ona udzielana po dokonaniu płatności. Aby uzyskać więcej informacji, postępuj zgodnie z instrukcjami autora poniżej lub skontaktuj się bezpośrednio z Traders_Endeavors.
TradingView NIE zaleca płacenia za skrypt ani jego używania, jeśli nie masz pełnego zaufania do jego autora i nie rozumiesz, jak działa. Możesz także znaleźć darmowe, open-source'owe alternatywy w naszej sekcji skryptów społecznościowych.
Instrukcje autora
Access our indicators: patreon.com/user?u=80987417