PROTECTED SOURCE SCRIPT
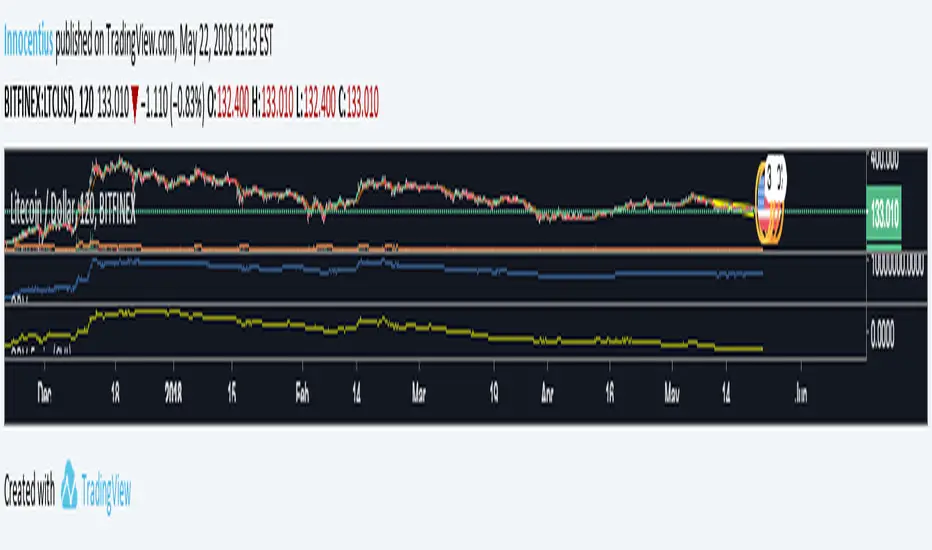
On Balance Volume locked 5min (CVI)

OBV shows the cumulation of the volume bars. All the volume in a green bar gets added to the obv and all the volume in a red bar gets subtracted. At a higher timeframe this can be misleading, because it filters out a lot of volume. This indicator locks the obv at 5 minutes, giving more information about the total amount of added and subtracted volume.
Skrypt chroniony
Ten skrypt został opublikowany jako zamknięty kod źródłowy. Można z tego korzystać swobodnie i bez żadnych ograniczeń — więcej informacji znajduje się tutaj.
Wyłączenie odpowiedzialności
Informacje i publikacje nie stanowią i nie powinny być traktowane jako porady finansowe, inwestycyjne, tradingowe ani jakiekolwiek inne rekomendacje dostarczane lub zatwierdzone przez TradingView. Więcej informacji znajduje się w Warunkach użytkowania.