OPEN-SOURCE SCRIPT
[Mubeen] True Bar Volume
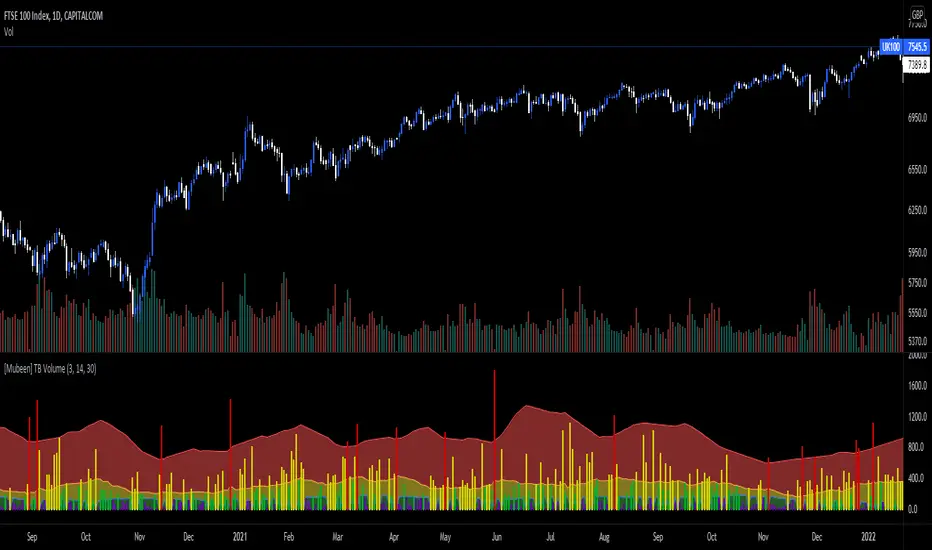
True Bar Volume, or TB Volume, is an indicator that measures the volume against the price action that has occurred.
Volume can sometimes be miss leading as it does not necessary show whether it had an impact on the price of the underlying, as one individual (represented as one volume) who has put $100 into the underlying can impact the underlying the same as hundred individuals (represented as hundred volume) putting $1 into the underlying: but the volume will widely differ and can cause confusion for outsiders. With the True Bar indicator, it aims to show abnormal behaviour in the price change against the amount of volume that was stated. It visualises the effect of the volume on the underlying by colour coding the different levels of True Bar results, divided into Red, Yellow, Green, Purple.
Red indicates that the price has changed way out of portion compared with the volume that was seen. It is compared against the highest TB Volume values through selected periods and once the volume as broken out of the high, it is considered an anomaly.
Yellow indicates that the TB Volume values are representing the mean values so it is considered as normal trading activity. Spikes in yellow values can also be seen as rise in high interest in the underlying.
Green indicates that the TB Volume values are under performing in market activity.
Purple indicates that is it a null result as investors might be looking for a better entry into a market, or seen as interest is low in the market.
TB Volume should not be used on it's own as it only gives a reporting measurement of the volume performance, which may be meaningless without the supplementation of other indicators.
Skrypt open-source
W zgodzie z duchem TradingView twórca tego skryptu udostępnił go jako open-source, aby użytkownicy mogli przejrzeć i zweryfikować jego działanie. Ukłony dla autora. Korzystanie jest bezpłatne, jednak ponowna publikacja kodu podlega naszym Zasadom serwisu.
Wyłączenie odpowiedzialności
Informacje i publikacje nie stanowią i nie powinny być traktowane jako porady finansowe, inwestycyjne, tradingowe ani jakiekolwiek inne rekomendacje dostarczane lub zatwierdzone przez TradingView. Więcej informacji znajduje się w Warunkach użytkowania.