OPEN-SOURCE SCRIPT
Layering Plots
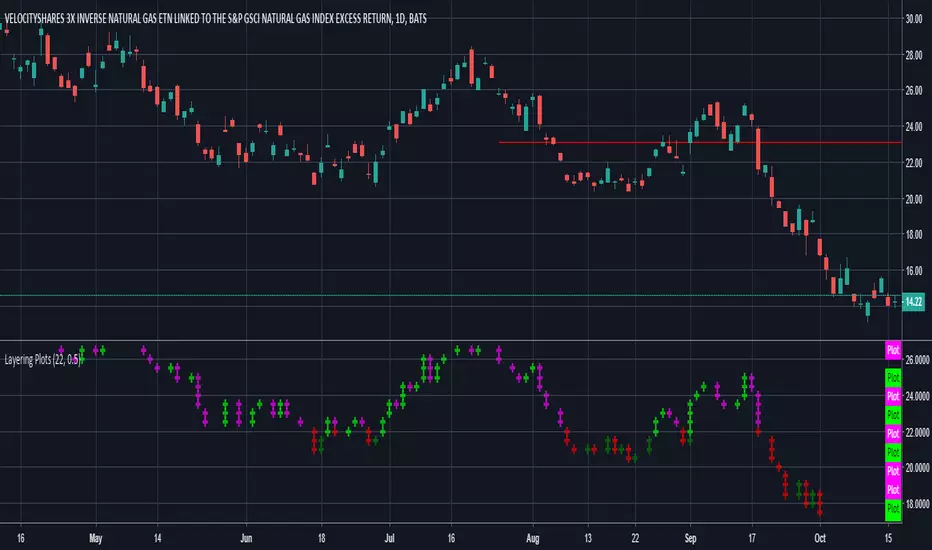
Lets say you want to layer into a position and you'd like to see it turn around. The study lets you set a baseline and increments above and below that baseline. A green cross is plotted ever time the price crosses above one of the increments, and red when crossing below that increment.
In the example I set the baseline to $22.1, and Layer increments to $0.50. So it will plot a cross every 50 cents above and below the baseline. This can be used on any chart period (daily, hourly, 5min...), but is limited to 9 layers above and below the baseline.
NOTES...
Lime = when price crosses above a layer that is above the baseline
Green = when price crosses above a layer below the baseline
Pink = when price crosses below a layer that is above the baseline
Red = when price crosses below a layer below the baseline
IMPORTANT...
This does not plot sometimes. I'm using a crossover crossunder function, and if a candle gaps open below and ends above a layer, this will not plot. It is not in error, just the way that function works. I will be looking to improve this study, wanted to share what I have for now.
Skrypt open-source
W zgodzie z duchem TradingView twórca tego skryptu udostępnił go jako open-source, aby użytkownicy mogli przejrzeć i zweryfikować jego działanie. Ukłony dla autora. Korzystanie jest bezpłatne, jednak ponowna publikacja kodu podlega naszym Zasadom serwisu.
Wyłączenie odpowiedzialności
Informacje i publikacje nie stanowią i nie powinny być traktowane jako porady finansowe, inwestycyjne, tradingowe ani jakiekolwiek inne rekomendacje dostarczane lub zatwierdzone przez TradingView. Więcej informacji znajduje się w Warunkach użytkowania.