Earlier this week, published an idea on how harmonic patterns can be used for trend following. This script is an attempt to implement the same.
🎲 Process
🎯 Derive Zigzag and scan harmonic patterns for last 5 confirmed pivots
🎯 If a pattern is found, highest point of pattern will become the bullish zone and lower point of the pattern will become bearish zone.
🎯 Since it is trend following method, when price reaches bullish zone, then the trend is considered as bullish and when price reaches bearish zone, the trend is considered as bearish.
🎯 If price does not touch both regions, then trend remains unchanged.
🎯 Bullish and bearish zone will change as and when new patterns are formed.
🎲 Note
Patterns are not created on latest pivot as last pivot will be unconfirmed and moving. Due to this, patterns appear after certain delay - patterns will not be real time. But, this is expected and does not impact the overall process.
When new pattern formed
https://www.tradingview.com/x/gGYDQ0xq/
When price breaks over the zones
https://www.tradingview.com/x/rJjgkJ0Y/
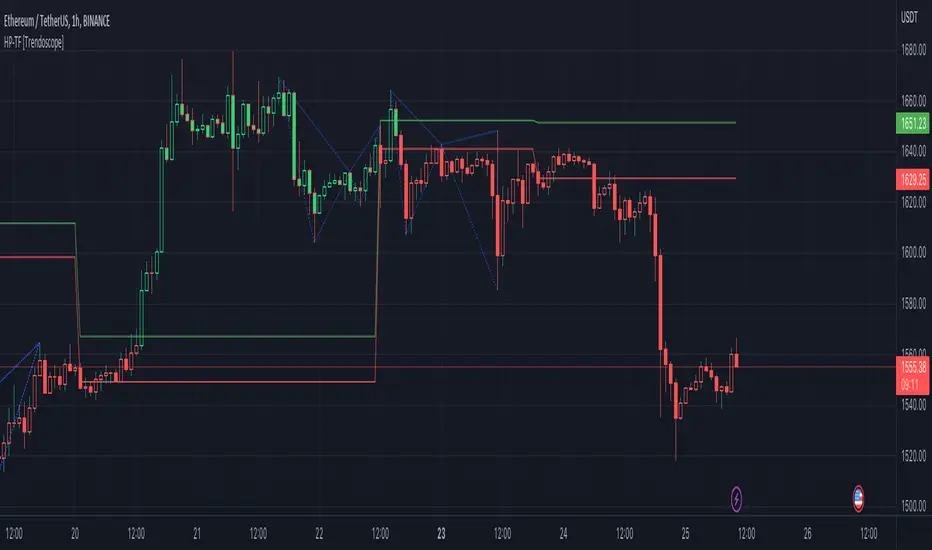
🎲 Output
🎯 Patterns formed are drawn in blue coloured lines. Due to pine limitation of max 500 lines, older patterns automatically get deleted when new ones come.
🎯 Bullish Zone and Bearish Zone are plotted in green and red colours and the zone will change whenever new pattern comes along.
🎯 Bar colors are changed according to calculated trend. Trend value can be 1 or -1 based on the current trend. You can also find the value in data window.
🎯 For simplicity purpose, input option for selection of specific patterns are not provided and also pattern names are not displayed on the chart.
🎲 Process
🎯 Derive Zigzag and scan harmonic patterns for last 5 confirmed pivots
🎯 If a pattern is found, highest point of pattern will become the bullish zone and lower point of the pattern will become bearish zone.
🎯 Since it is trend following method, when price reaches bullish zone, then the trend is considered as bullish and when price reaches bearish zone, the trend is considered as bearish.
🎯 If price does not touch both regions, then trend remains unchanged.
🎯 Bullish and bearish zone will change as and when new patterns are formed.
🎲 Note
Patterns are not created on latest pivot as last pivot will be unconfirmed and moving. Due to this, patterns appear after certain delay - patterns will not be real time. But, this is expected and does not impact the overall process.
When new pattern formed
https://www.tradingview.com/x/gGYDQ0xq/
When price breaks over the zones
https://www.tradingview.com/x/rJjgkJ0Y/
🎲 Output
🎯 Patterns formed are drawn in blue coloured lines. Due to pine limitation of max 500 lines, older patterns automatically get deleted when new ones come.
🎯 Bullish Zone and Bearish Zone are plotted in green and red colours and the zone will change whenever new pattern comes along.
🎯 Bar colors are changed according to calculated trend. Trend value can be 1 or -1 based on the current trend. You can also find the value in data window.
🎯 For simplicity purpose, input option for selection of specific patterns are not provided and also pattern names are not displayed on the chart.
Informacje o Wersji
Updated code to have more input options to determine bullish and bearish range.Informacje o Wersji
Update signature :)Informacje o Wersji
Added option to use log scale.Skrypt open-source
W zgodzie z duchem TradingView twórca tego skryptu udostępnił go jako open-source, aby użytkownicy mogli przejrzeć i zweryfikować jego działanie. Ukłony dla autora. Korzystanie jest bezpłatne, jednak ponowna publikacja kodu podlega naszym Zasadom serwisu.
Trial - trendoscope.io/trial
Subscribe - trendoscope.io/pricing
Blog - docs.trendoscope.io
Subscribe - trendoscope.io/pricing
Blog - docs.trendoscope.io
Wyłączenie odpowiedzialności
Informacje i publikacje nie stanowią i nie powinny być traktowane jako porady finansowe, inwestycyjne, tradingowe ani jakiekolwiek inne rekomendacje dostarczane lub zatwierdzone przez TradingView. Więcej informacji znajduje się w Warunkach użytkowania.
Skrypt open-source
W zgodzie z duchem TradingView twórca tego skryptu udostępnił go jako open-source, aby użytkownicy mogli przejrzeć i zweryfikować jego działanie. Ukłony dla autora. Korzystanie jest bezpłatne, jednak ponowna publikacja kodu podlega naszym Zasadom serwisu.
Trial - trendoscope.io/trial
Subscribe - trendoscope.io/pricing
Blog - docs.trendoscope.io
Subscribe - trendoscope.io/pricing
Blog - docs.trendoscope.io
Wyłączenie odpowiedzialności
Informacje i publikacje nie stanowią i nie powinny być traktowane jako porady finansowe, inwestycyjne, tradingowe ani jakiekolwiek inne rekomendacje dostarczane lub zatwierdzone przez TradingView. Więcej informacji znajduje się w Warunkach użytkowania.