OPEN-SOURCE SCRIPT
Crypto$ure EMA with 4H Trend Table
The Crypto URE EMA indicator provides a clear, multi-timeframe confirmation setup to help you align your shorter-term trades with the broader market trend.
Key Features:
4-Hour EMA Trend Insight:
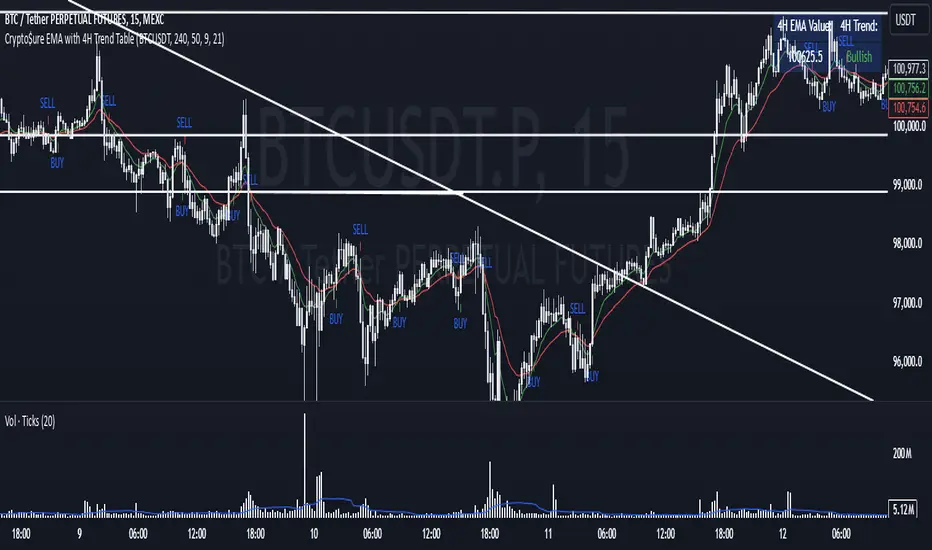
A table, displayed at the top-right corner of your chart, shows the current 4-hour EMA value and whether the 4-hour trend is Bullish, Bearish, or Neutral. This gives you a reliable, higher-timeframe perspective, making it easier to understand the general market direction.
Lower Timeframe Signals (e.g., 25m or 15m):
On your chosen chart timeframe, the indicator plots two EMAs (Fast and Slow).
A Buy Signal (an up arrow) appears when the Fast EMA crosses above the Slow EMA, indicating potential upward momentum.
A Sell Signal (a down arrow) appears when the Fast EMA crosses below the Slow EMA, indicating potential downward momentum.
Manual Confirmation for Better Accuracy:
While the Buy/Sell signals come directly from the shorter timeframe, you can use the 4-hour trend information from the table to confirm or filter these signals. For example, if the 4-hour trend is Bullish, the Buy signals on the shorter timeframe may carry more weight. If it’s Bearish, then the Sell signals might be more reliable.
How to Use:
Add the CryptoURE EMA indicator to your chart.
Check the top-right table to see the current 4-hour EMA trend.
Watch for Buy (up arrow) or Sell (down arrow) signals on your current timeframe.
For added confidence, consider taking Buy signals only when the 4-hour trend is Bullish and Sell signals when the 4-hour trend is Bearish.
Note:
This indicator does not generate trading orders. Instead, it provides actionable insights to help guide your discretionary decision-making. Always consider additional market context, risk management practices, and personal trading rules before acting on any signal.
Key Features:
4-Hour EMA Trend Insight:
A table, displayed at the top-right corner of your chart, shows the current 4-hour EMA value and whether the 4-hour trend is Bullish, Bearish, or Neutral. This gives you a reliable, higher-timeframe perspective, making it easier to understand the general market direction.
Lower Timeframe Signals (e.g., 25m or 15m):
On your chosen chart timeframe, the indicator plots two EMAs (Fast and Slow).
A Buy Signal (an up arrow) appears when the Fast EMA crosses above the Slow EMA, indicating potential upward momentum.
A Sell Signal (a down arrow) appears when the Fast EMA crosses below the Slow EMA, indicating potential downward momentum.
Manual Confirmation for Better Accuracy:
While the Buy/Sell signals come directly from the shorter timeframe, you can use the 4-hour trend information from the table to confirm or filter these signals. For example, if the 4-hour trend is Bullish, the Buy signals on the shorter timeframe may carry more weight. If it’s Bearish, then the Sell signals might be more reliable.
How to Use:
Add the Crypto
Check the top-right table to see the current 4-hour EMA trend.
Watch for Buy (up arrow) or Sell (down arrow) signals on your current timeframe.
For added confidence, consider taking Buy signals only when the 4-hour trend is Bullish and Sell signals when the 4-hour trend is Bearish.
Note:
This indicator does not generate trading orders. Instead, it provides actionable insights to help guide your discretionary decision-making. Always consider additional market context, risk management practices, and personal trading rules before acting on any signal.
Skrypt open-source
W zgodzie z duchem TradingView twórca tego skryptu udostępnił go jako open-source, aby użytkownicy mogli przejrzeć i zweryfikować jego działanie. Ukłony dla autora. Korzystanie jest bezpłatne, jednak ponowna publikacja kodu podlega naszym Zasadom serwisu.
Wyłączenie odpowiedzialności
Informacje i publikacje nie stanowią i nie powinny być traktowane jako porady finansowe, inwestycyjne, tradingowe ani jakiekolwiek inne rekomendacje dostarczane lub zatwierdzone przez TradingView. Więcej informacji znajduje się w Warunkach użytkowania.