OPEN-SOURCE SCRIPT
Hancock - Floating O/B O/S IFT RSI T3MA
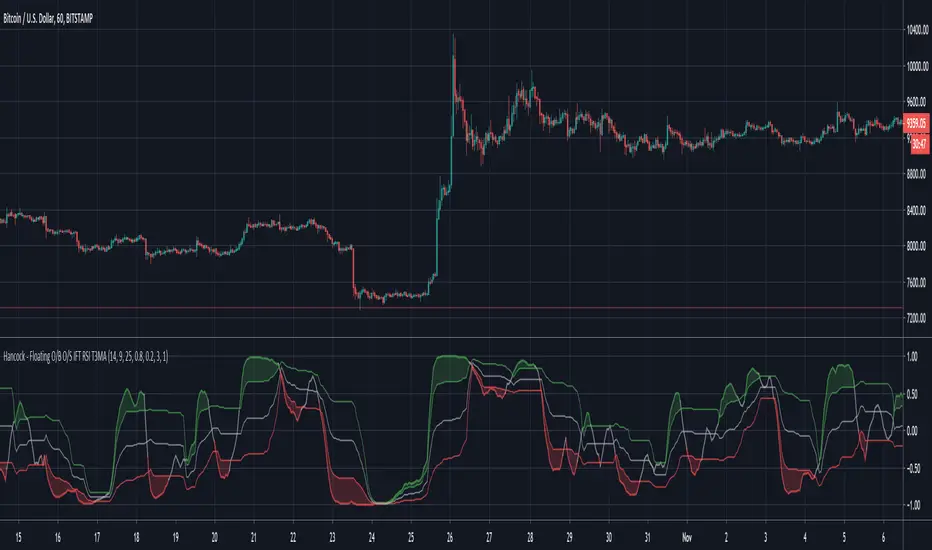
This is a version of the Inverse Fisher Transform Relative Strength Index with floating oversold and overbought thresholds.
Configurable parameters:
RSI length - This is the period used for the RSI .
RSI Smooth Length - This is the smoothing period of the Weighted Moving Average used for the smoothing in Inverse Fisher Transform .
RSI Threshold Period - This is the period used for calculating the floating oversold and overbought thresholds.
RSI Overbought - Configures the overbought threshold (80% default).
RSI Oversold - Configures the oversold threshold (20% default).
T3 Smoothing - Enabling this applies T3MA smoothing to the RSI.
T3 Length - This is the period used for the T3MA smoothing of the RSI.
T3 Factor - This is the factor used for the T3MA smoothing of the RSI.
RSI line breaching the thresholds are clearly indicated by filled chart plots.
An inverse Fisher transform of RSI is designed to enhance the extremes (overbought and oversold zones), in combination with floating thresholds this version allows faster and cleaner trend detection and identification. With additional smoothing, false signals can be avoided. As with any other indicator some experimenting with parameters is advised (in order to find optimal settings for symbol/time frame pair).
Happy trading folks!
Hancock
Skrypt open-source
W zgodzie z duchem TradingView twórca tego skryptu udostępnił go jako open-source, aby użytkownicy mogli przejrzeć i zweryfikować jego działanie. Ukłony dla autora. Korzystanie jest bezpłatne, jednak ponowna publikacja kodu podlega naszym Zasadom serwisu.
Wyłączenie odpowiedzialności
Informacje i publikacje nie stanowią i nie powinny być traktowane jako porady finansowe, inwestycyjne, tradingowe ani jakiekolwiek inne rekomendacje dostarczane lub zatwierdzone przez TradingView. Więcej informacji znajduje się w Warunkach użytkowania.