OPEN-SOURCE SCRIPT
Adaptive Trend Lines [MAMA and FAMA]
Updated my previous algo on the Adaptive Trend lines, however I have added new functionalities and sorted out the settings.
You can now switch between normalized and non-normalized settings, the colors have also been updated and look much better.
The MAMA and FAMA
These indicators was originally developed by John F. Ehlers (Stocks & Commodities V. 19:10: MESA Adaptive Moving Averages). Everget wrote the initial functions for these in pine script. I have simply normalized the indicators and chosen to use the Laplace transformation instead of the hilbert transformation
How the Indicator Works:
The indicator employs a series of complex calculations, but we'll break it down into key steps to understand its functionality:
LaplaceTransform: Calculates the Laplace distribution for the given src input. The Laplace distribution is a continuous probability distribution, also known as the double exponential distribution. I use this because of the assymetrical return profile
MESA Period: The indicator calculates a MESA period, which represents the dominant cycle length in the price data. This period is continuously adjusted to adapt to market changes.
InPhase and Quadrature Components: The InPhase and Quadrature components are derived from the Hilbert Transform output. These components represent different aspects of the price's cyclical behavior.
Homodyne Discriminator: The Homodyne Discriminator is a phase-sensitive technique used to determine the phase and amplitude of a signal. It helps in detecting trend changes.
Alpha Calculation: Alpha represents the adaptive factor that adjusts the sensitivity of the indicator. It is based on the MESA period and the phase of the InPhase component. Alpha helps in dynamically adjusting the indicator's responsiveness to changes in market conditions.
MAMA and FAMA Calculation: The MAMA and FAMA values are calculated using the adaptive factor (alpha) and the input price data. These values are essentially adaptive moving averages that aim to capture the current trend more effectively than traditional moving averages.
But Omar, why would anyone want to use this?
The MAMA and FAMA lines offer benefits:
The indicator offers a distinct advantage over conventional moving averages due to its adaptive nature, which allows it to adjust to changing market conditions. This adaptability ensures that investors can stay on the right side of the trend, as the indicator becomes more responsive during trending periods and less sensitive in choppy or sideways markets.
One of the key strengths of this indicator lies in its ability to identify trends effectively by combining the MESA and MAMA techniques. By doing so, it efficiently filters out market noise, making it highly valuable for trend-following strategies. Investors can rely on this feature to gain clearer insights into the prevailing trends and make well-informed trading decisions.
This indicator is primarily suppoest to be used on the big timeframes to see which trend is prevailing, however I am not against someone using it on a timeframe below the 1D, just be careful if you are using this for modern portfolio theory, this is not suppoest to be a mid-term component, but rather a long term component that works well with proper use of detrended fluctuation analysis.
Dont hesitate to ask me if you have any questions
Again, I want to give credit to Everget and ChartPrime!
Code explanation as required by House Rules:
Pine Script®
input.float: Used to create input fields for the user to set the fastLimit and slowLimit values.
input: General function to get user inputs, like the data source (close price) used for calculations.
Pine Script®
input.int: Creates an input field for the normalization period.
input.bool: Allows the user to toggle normalization on or off.
Color settings in the code:
Pine Script®
Constants and functions
Pine Script®
math.pi: Represents the mathematical constant π (pi).
laplace: A function that applies the Laplace transform to the source data.
_computeComponent: Computes a component of the data using the Laplace transform.
_smoothComponent: Smooths data by averaging the current value with the previous one (nz function is used to handle null values).
Alpha function:
Pine Script®
_computeAlpha: Calculates the adaptive alpha value based on the fastLimit and slowLimit. This value is crucial for determining the MAMA and FAMA lines.
Calculating MAMA and FAMA:
Pine Script®
Normalization:
Pine Script®
ta.lowest and ta.highest: Find the lowest and highest values of mama_fama_diff over the normalization period.
The oscillator is normalized to a range, making it easier to compare over different periods.
And finally, the plotting:
Pine Script®
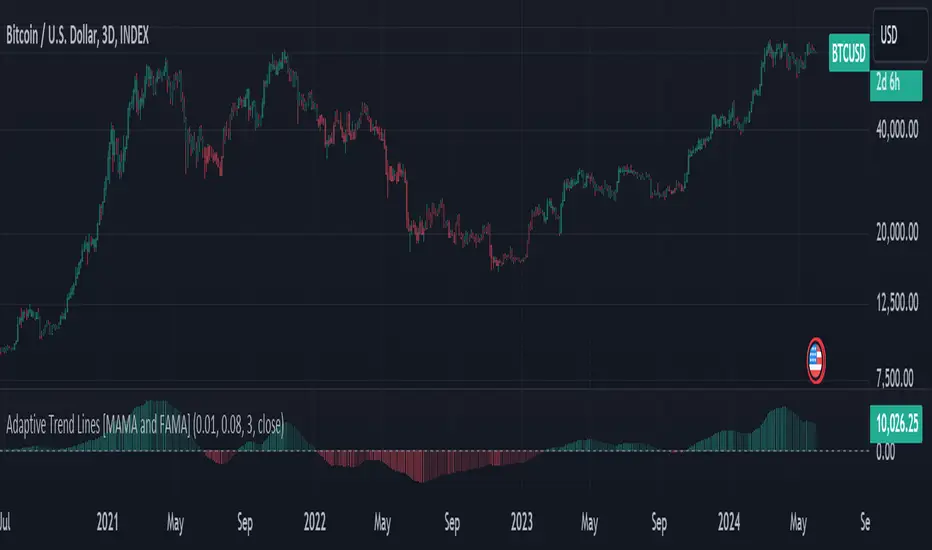
Example of Normalized settings:

Example for setup:
Try to make sure the lower timeframe follows the higher timeframe if you take a trade based on this indicator!

You can now switch between normalized and non-normalized settings, the colors have also been updated and look much better.
The MAMA and FAMA
These indicators was originally developed by John F. Ehlers (Stocks & Commodities V. 19:10: MESA Adaptive Moving Averages). Everget wrote the initial functions for these in pine script. I have simply normalized the indicators and chosen to use the Laplace transformation instead of the hilbert transformation
How the Indicator Works:
The indicator employs a series of complex calculations, but we'll break it down into key steps to understand its functionality:
LaplaceTransform: Calculates the Laplace distribution for the given src input. The Laplace distribution is a continuous probability distribution, also known as the double exponential distribution. I use this because of the assymetrical return profile
MESA Period: The indicator calculates a MESA period, which represents the dominant cycle length in the price data. This period is continuously adjusted to adapt to market changes.
InPhase and Quadrature Components: The InPhase and Quadrature components are derived from the Hilbert Transform output. These components represent different aspects of the price's cyclical behavior.
Homodyne Discriminator: The Homodyne Discriminator is a phase-sensitive technique used to determine the phase and amplitude of a signal. It helps in detecting trend changes.
Alpha Calculation: Alpha represents the adaptive factor that adjusts the sensitivity of the indicator. It is based on the MESA period and the phase of the InPhase component. Alpha helps in dynamically adjusting the indicator's responsiveness to changes in market conditions.
MAMA and FAMA Calculation: The MAMA and FAMA values are calculated using the adaptive factor (alpha) and the input price data. These values are essentially adaptive moving averages that aim to capture the current trend more effectively than traditional moving averages.
But Omar, why would anyone want to use this?
The MAMA and FAMA lines offer benefits:
The indicator offers a distinct advantage over conventional moving averages due to its adaptive nature, which allows it to adjust to changing market conditions. This adaptability ensures that investors can stay on the right side of the trend, as the indicator becomes more responsive during trending periods and less sensitive in choppy or sideways markets.
One of the key strengths of this indicator lies in its ability to identify trends effectively by combining the MESA and MAMA techniques. By doing so, it efficiently filters out market noise, making it highly valuable for trend-following strategies. Investors can rely on this feature to gain clearer insights into the prevailing trends and make well-informed trading decisions.
This indicator is primarily suppoest to be used on the big timeframes to see which trend is prevailing, however I am not against someone using it on a timeframe below the 1D, just be careful if you are using this for modern portfolio theory, this is not suppoest to be a mid-term component, but rather a long term component that works well with proper use of detrended fluctuation analysis.
Dont hesitate to ask me if you have any questions
Again, I want to give credit to Everget and ChartPrime!
Code explanation as required by House Rules:
fastLimit = input.float(title='Fast Limit', step=0.01, defval=0.01, group = "Indicator Settings")
slowLimit = input.float(title='Slow Limit', step=0.01, defval=0.08, group = "Indicator Settings")
src = input(title='Source', defval=close, group = "Indicator Settings")
input.float: Used to create input fields for the user to set the fastLimit and slowLimit values.
input: General function to get user inputs, like the data source (close price) used for calculations.
norm_period = input.int(3, 'Normalization Period', 1, group = "Normalized Settings")
norm = input.bool(defval = true, title = "Use normalization", group = "Normalized Settings")
input.int: Creates an input field for the normalization period.
input.bool: Allows the user to toggle normalization on or off.
Color settings in the code:
col_up = input.color(#22ab94, group = "Color Settings")
col_dn = input.color(#f7525f, group = "Color Settings")
Constants and functions
var float PI = math.pi
laplace(src) =>
(0.5) * math.exp(-math.abs(src))
_computeComponent(src, mesaPeriodMult) =>
out = laplace(src) * mesaPeriodMult
out
_smoothComponent(src) =>
out = 0.2 * src + 0.8 * nz(src[1])
out
math.pi: Represents the mathematical constant π (pi).
laplace: A function that applies the Laplace transform to the source data.
_computeComponent: Computes a component of the data using the Laplace transform.
_smoothComponent: Smooths data by averaging the current value with the previous one (nz function is used to handle null values).
Alpha function:
_computeAlpha(src, fastLimit, slowLimit) =>
mesaPeriod = 0.0
mesaPeriodMult = 0.075 * nz(mesaPeriod[1]) + 0.54
...
alpha = math.max(fastLimit / deltaPhase, slowLimit)
out = alpha
out
_computeAlpha: Calculates the adaptive alpha value based on the fastLimit and slowLimit. This value is crucial for determining the MAMA and FAMA lines.
Calculating MAMA and FAMA:
mama = 0.0
mama := alpha * src + (1 - alpha) * nz(mama[1])
fama = 0.0
fama := alpha2 * mama + (1 - alpha2) * nz(fama[1])
Normalization:
lowest = ta.lowest(mama_fama_diff, norm_period)
highest = ta.highest(mama_fama_diff, norm_period)
normalized = (mama_fama_diff - lowest) / (highest - lowest) - 0.5
ta.lowest and ta.highest: Find the lowest and highest values of mama_fama_diff over the normalization period.
The oscillator is normalized to a range, making it easier to compare over different periods.
And finally, the plotting:
plot(norm == true ? normalized : na, style=plot.style_columns, color=col_wn, title = "mama_fama_diff Oscillator Normalized")
plot(norm == false ? mama_fama_diff : na, style=plot.style_columns, color=col_wnS, title = "mama_fama_diff Oscillator")
Example of Normalized settings:
Example for setup:
Try to make sure the lower timeframe follows the higher timeframe if you take a trade based on this indicator!
Skrypt open-source
W zgodzie z duchem TradingView twórca tego skryptu udostępnił go jako open-source, aby użytkownicy mogli przejrzeć i zweryfikować jego działanie. Ukłony dla autora. Korzystanie jest bezpłatne, jednak ponowna publikacja kodu podlega naszym Zasadom serwisu.
Join my community where i share signals and my secret algos:
Telegram:
t.me/ikkeomarfree
I can also pass funded accounts for you!
$50,000 accounts
Just dm my Telegram @IkkeOmar
Telegram:
t.me/ikkeomarfree
I can also pass funded accounts for you!
$50,000 accounts
Just dm my Telegram @IkkeOmar
Wyłączenie odpowiedzialności
Informacje i publikacje nie stanowią i nie powinny być traktowane jako porady finansowe, inwestycyjne, tradingowe ani jakiekolwiek inne rekomendacje dostarczane lub zatwierdzone przez TradingView. Więcej informacji znajduje się w Warunkach użytkowania.