OPEN-SOURCE SCRIPT
Zaktualizowano Open-Close Upward Difference Marker

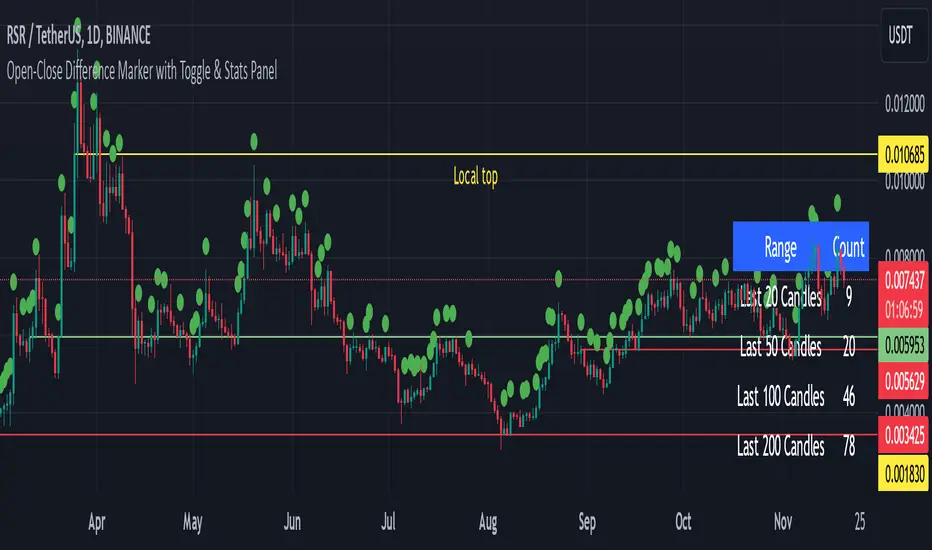
This indicator, called "Open-Close Upward Difference Marker", is designed to help traders quickly spot candles where the price has moved up significantly within a certain percentage. It places a small green dot above any candle where the closing price is higher than the opening price (meaning the price went up) and the percentage difference between the open and close is greater than a set threshold.
Here’s how it works:
You can set a percentage threshold (e.g., 1%) using the input field. This threshold helps filter out small price changes, so the indicator only shows larger movements.
If the price increase from the open to the close is greater than the threshold, a small green dot will appear above the candle, letting you quickly identify upward price movements that meet your criteria.
It ignores downward price movements, so you’ll only see green dots for candles where the price has gone up.
This indicator is helpful for spotting upward trends and significant price increases, making it a simple visual aid for beginner traders.
Informacje o Wersji
This custom indicator highlights candles where the difference between the Open and Close prices meets a specified threshold. You can toggle between two modes—one for upward (bullish) candles and the other for downward (bearish) candles—based on the percentage difference between the Open and Close prices.Features:
1.Upward Mode: Looks for candles where the Close is higher than the Open and the percentage difference exceeds the defined threshold.
2.Downward Mode: Looks for candles where the Close is lower than the Open and the percentage difference exceeds the defined threshold.
Inputs:
1.Percentage Threshold: Set the percentage difference (e.g., 1 for 1%) that determines when a candle is considered significant based on the difference between the Open and Close prices.
2.Upward Mode (Toggle): Enable this mode to focus on bullish candles (Close > Open). Disable it to focus on bearish candles (Close < Open).
Visuals:
1.Green Dots above the candles in Upward Mode for candles where the price difference exceeds the threshold.
2.Red Dots below the candles in Downward Mode for candles where the price difference exceeds the threshold.
Stats Panel:
A table in the top right corner displays how many candles in the last:
20 candles
50 candles
100 candles
200 candles
...satisfy the condition based on the selected mode (upward or downward).
This indicator helps you visually identify significant price movements and provides insight into how frequently these movements occur in the recent price action.
Skrypt open-source
W zgodzie z duchem TradingView twórca tego skryptu udostępnił go jako open-source, aby użytkownicy mogli przejrzeć i zweryfikować jego działanie. Ukłony dla autora. Korzystanie jest bezpłatne, jednak ponowna publikacja kodu podlega naszym Zasadom serwisu.
Wyłączenie odpowiedzialności
Informacje i publikacje nie stanowią i nie powinny być traktowane jako porady finansowe, inwestycyjne, tradingowe ani jakiekolwiek inne rekomendacje dostarczane lub zatwierdzone przez TradingView. Więcej informacji znajduje się w Warunkach użytkowania.