OPEN-SOURCE SCRIPT
20 Week SMA Risk Rating
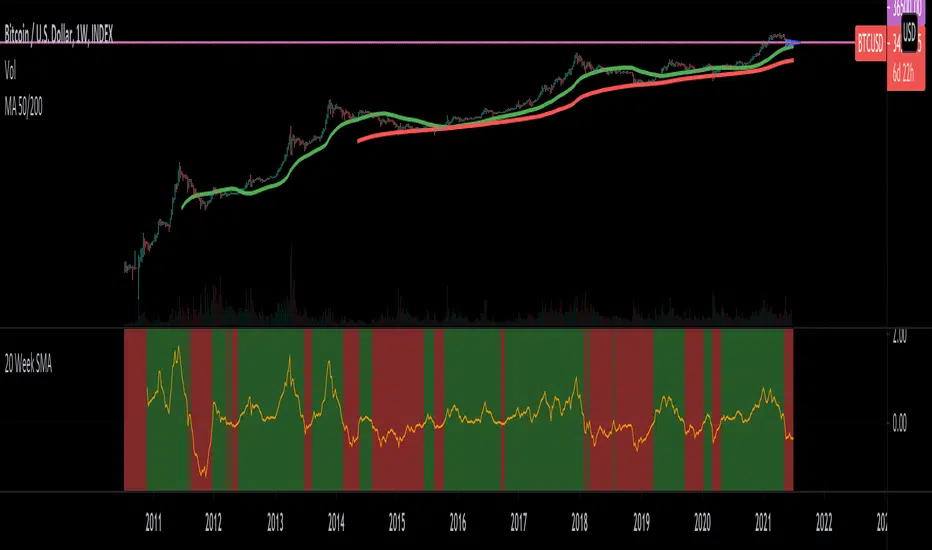
Use this indicator in the Weekly graph.
Green background indicates we are above the 20-day SMA; red background indicates we are under the 20-day SMA.
The lower we are the 20-day SMA indicates the bottom is near. The higher we are the 20-day SMA indicates there's the possibility to start climbing down.
Green background indicates we are above the 20-day SMA; red background indicates we are under the 20-day SMA.
The lower we are the 20-day SMA indicates the bottom is near. The higher we are the 20-day SMA indicates there's the possibility to start climbing down.
Skrypt open-source
W zgodzie z duchem TradingView twórca tego skryptu udostępnił go jako open-source, aby użytkownicy mogli przejrzeć i zweryfikować jego działanie. Ukłony dla autora. Korzystanie jest bezpłatne, jednak ponowna publikacja kodu podlega naszym Zasadom serwisu.
Wyłączenie odpowiedzialności
Informacje i publikacje nie stanowią i nie powinny być traktowane jako porady finansowe, inwestycyjne, tradingowe ani jakiekolwiek inne rekomendacje dostarczane lub zatwierdzone przez TradingView. Więcej informacji znajduje się w Warunkach użytkowania.