OPEN-SOURCE SCRIPT
Zaktualizowano Normalized True Range - Grouped by Weekdays
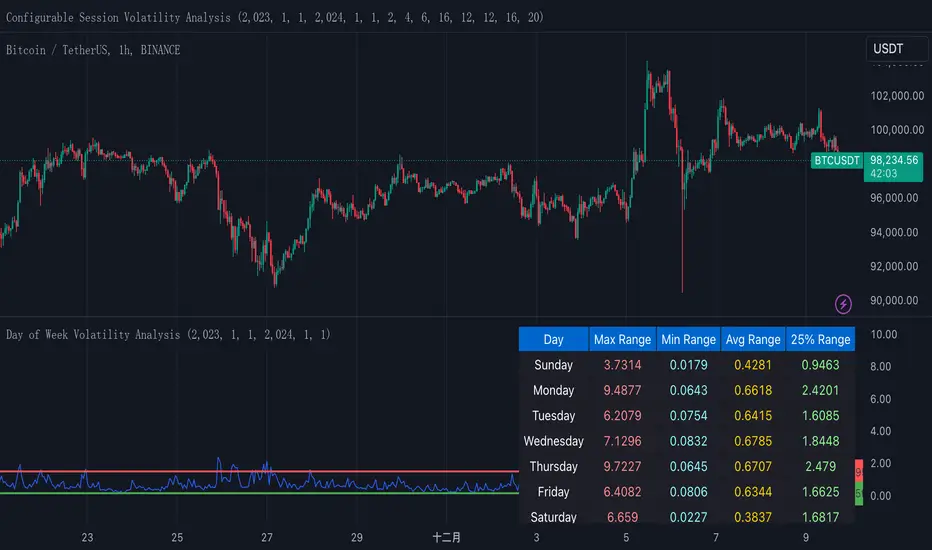
This indicator helps traders analyze daily volatility patterns across different days of the week by calculating normalized price ranges.
These bounds appear as horizontal lines on the chart, making it easy to spot when current volatility breaks out of its historical norms.
These bounds appear as horizontal lines on the chart, making it easy to spot when current volatility breaks out of its historical norms.
Informacje o Wersji
This indicator helps traders analyze daily volatility patterns across different days of the week by calculating normalized price ranges.Unlike traditional volatility measures, it uses a normalized approach by dividing the daily range (high-low) by the midpoint price and multiplying by 100, providing a percentage-based measure that's comparable across different price levels. This normalization makes it particularly useful for comparing volatility patterns across different assets or time periods.
The indicator also includes a statistical overlay that highlights extreme volatility events. By calculating the 5th and 95th percentiles of the normalized ranges within your specified date range, it creates upper and lower bounds that help identify outlier days where volatility was exceptionally high or low.
These bounds appear as horizontal lines on the chart, making it easy to spot when current volatility breaks out of its historical norms.
The data is presented in both visual and tabular formats, with a comprehensive table showing the maximum, minimum, average, and 25th percentile ranges for each day of the week. This dual presentation allows traders to both quickly spot patterns visually and access detailed statistics for deeper analysis.
The user can customize the analysis period through simple date range inputs, making it flexible for different analytical timeframes.
Skrypt open-source
W zgodzie z duchem TradingView twórca tego skryptu udostępnił go jako open-source, aby użytkownicy mogli przejrzeć i zweryfikować jego działanie. Ukłony dla autora. Korzystanie jest bezpłatne, jednak ponowna publikacja kodu podlega naszym Zasadom serwisu.
Wyłączenie odpowiedzialności
Informacje i publikacje nie stanowią i nie powinny być traktowane jako porady finansowe, inwestycyjne, tradingowe ani jakiekolwiek inne rekomendacje dostarczane lub zatwierdzone przez TradingView. Więcej informacji znajduje się w Warunkach użytkowania.