OPEN-SOURCE SCRIPT
CakeProfits-SMA+EMA G
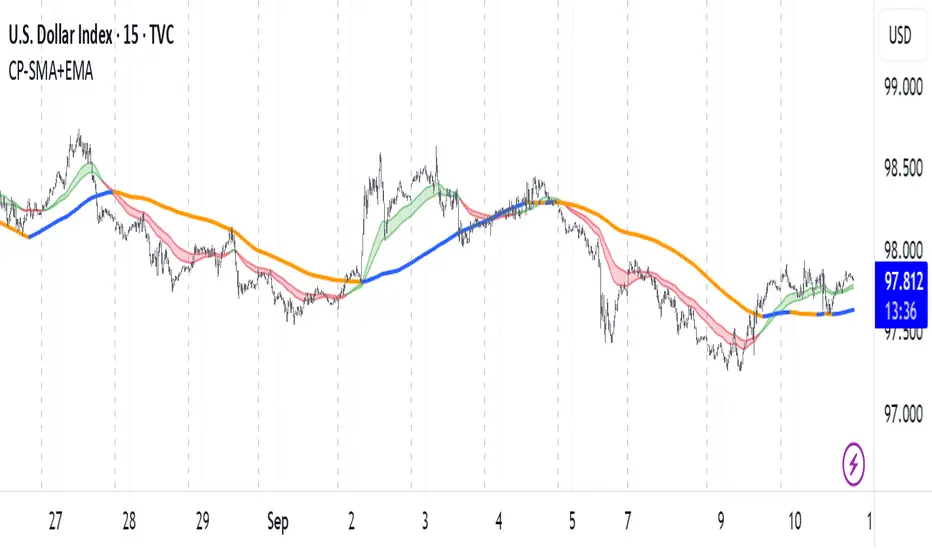
This indicator plots a dynamic color coded MA ribbon that visually highlights the relationship between a Simple Moving Average (SMA) and an Exponential Moving Average (EMA). The ribbon changes color based on bullish or bearish crossovers:
Bullish – EMA crosses above the SMA, indicating upward momentum.
Bearish – EMA crosses below the SMA, signaling potential downward pressure.
The SMA smooths out long-term price trends, while the EMA responds faster to recent price action. Together, they help traders identify shifts in market direction and momentum strength. The ribbon provides a clear, at-a-glance view of trend changes and can be used on any timeframe or market.
There is also the option to display a 200 SMA that is also color coded.
Common Uses:
Confirming trend direction.
Identifying early entry/exit points.
Filtering trades for trend-following strategies.
Skrypt open-source
W duchu TradingView twórca tego skryptu udostępnił go jako open-source, aby traderzy mogli analizować i weryfikować jego funkcjonalność. Brawo dla autora! Możesz korzystać z niego za darmo, ale pamiętaj, że ponowna publikacja kodu podlega naszym Zasadom Społeczności.
Wyłączenie odpowiedzialności
Informacje i publikacje przygotowane przez TradingView lub jego użytkowników, prezentowane na tej stronie, nie stanowią rekomendacji ani porad handlowych, inwestycyjnych i finansowych i nie powinny być w ten sposób traktowane ani wykorzystywane. Więcej informacji na ten temat znajdziesz w naszym Regulaminie.