OPEN-SOURCE SCRIPT
Sharpe Ratio Indicator (180)
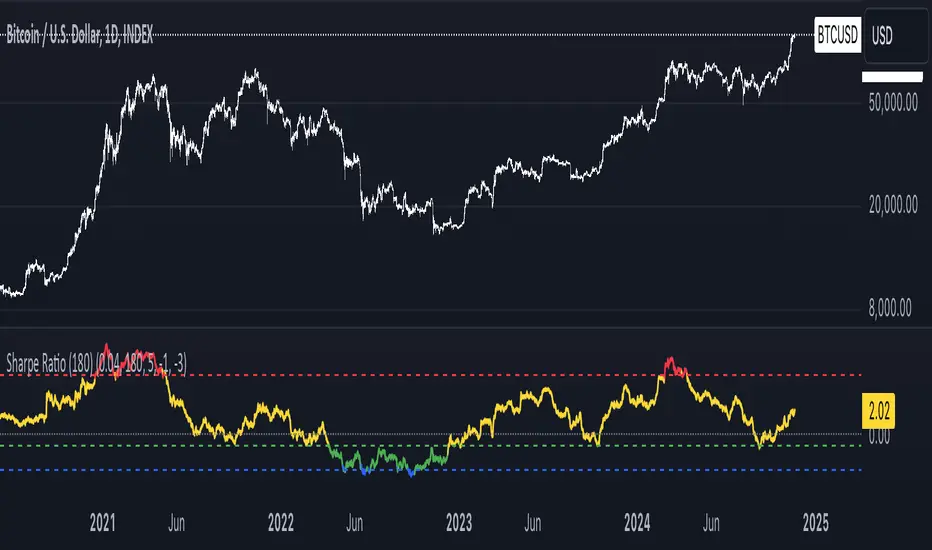
Meant to be used on the 1D chart and on BTC.
The Sharpe Ratio Indicator (180 days) is a tool for evaluating risk-adjusted returns, designed for investors who want to assess whether BTC is overvalued, undervalued, or in a neutral state. It plots the Sharpe Ratio over the past 180 days, color-coded to indicate valuation states:
- Red: Overvalued (Sharpe Ratio > 5).
- Green: Undervalued (Sharpe Ratio < -1).
-Blue: Critically Undervalued (Sharpe Ratio <-3).
- Yellow: Neutral (between -1 and 5).
Note that you can change those values yourself in the settings of the indicator.
Strengths:
- Real-time feedback on risk-adjusted returns helps in making timely investment decisions.
- Color-coded signals (red, green, blue and yellow) provide an intuitive, visual indication of the asset's valuation.
- Flexible: Easily adjustable to different subjective valuation levels and risk-free rates.
All hail to Professor Adam and The Real World Community!
Skrypt open-source
W zgodzie z duchem TradingView twórca tego skryptu udostępnił go jako open-source, aby użytkownicy mogli przejrzeć i zweryfikować jego działanie. Ukłony dla autora. Korzystanie jest bezpłatne, jednak ponowna publikacja kodu podlega naszym Zasadom serwisu.
Wyłączenie odpowiedzialności
Informacje i publikacje nie stanowią i nie powinny być traktowane jako porady finansowe, inwestycyjne, tradingowe ani jakiekolwiek inne rekomendacje dostarczane lub zatwierdzone przez TradingView. Więcej informacji znajduje się w Warunkach użytkowania.