OPEN-SOURCE SCRIPT
Zaktualizowano TTM FCFF Yield %
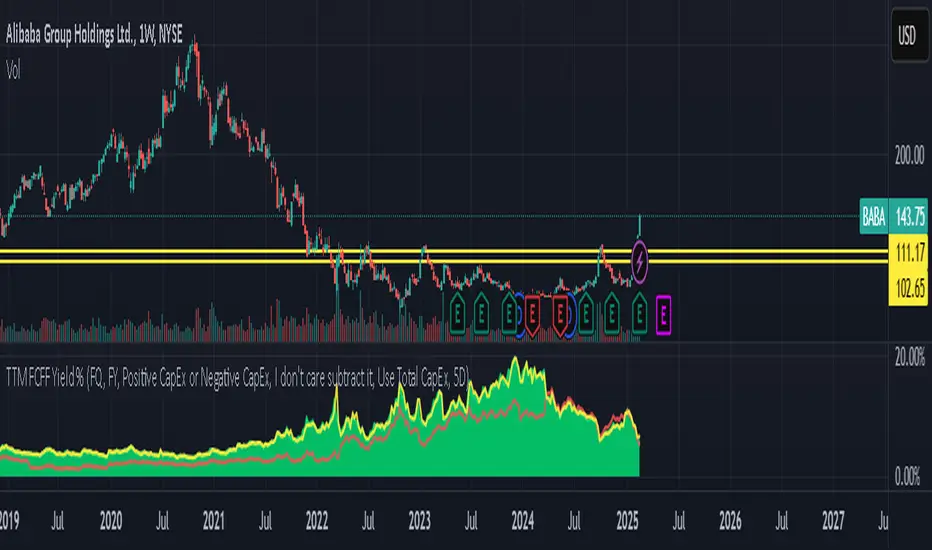
An indicator that shows the Free Cash Flow yield daily for the underlying ticker. Useful for when you need to screen for ideas, or the news just broke out and you want to make a calculated purchase - rather than buying at whatever price it is at the moment.
Green line tracks daily Free Cash Flow yield to Enterprise Value.
Where Free Cash Flow is defined as = Cashflow from Operations + Depreciation and Amortization (from the income statement) - Capital Expenditure (fixed assets) - Change in Working Capital
And where Enterprise Value is defined as = Market Capitalization + Net Debt
Red line tracks Free Cash Flow of financial year and what FCFF yield does that equate to if the stock current trades at the price right now.
Reminder: When working with international equities. Be mindful of whether they report FQ or FH. For example, France only reports FH, so it's better to use TTM FHFree Cash Flow results. If you didn't toggle FH in the indicator settings, it will automatically set as FQ and it will not show anything.
GLHF
Informacje o Wersji
Added new feature to calculate FCFF Yield % using historical prices in case there is market noise. As negative FCFF Yield % looks like it is treading back into positive territory, but in reality it is just because EV is calculated using Market Capitalization which drags it upwards.Informacje o Wersji
Patched!Informacje o Wersji
Patch 2.Informacje o Wersji
Patch 3 lolInformacje o Wersji
Last patch I promise lolSkrypt open-source
W zgodzie z duchem TradingView twórca tego skryptu udostępnił go jako open-source, aby użytkownicy mogli przejrzeć i zweryfikować jego działanie. Ukłony dla autora. Korzystanie jest bezpłatne, jednak ponowna publikacja kodu podlega naszym Zasadom serwisu.
Wyłączenie odpowiedzialności
Informacje i publikacje nie stanowią i nie powinny być traktowane jako porady finansowe, inwestycyjne, tradingowe ani jakiekolwiek inne rekomendacje dostarczane lub zatwierdzone przez TradingView. Więcej informacji znajduje się w Warunkach użytkowania.
Skrypt open-source
W zgodzie z duchem TradingView twórca tego skryptu udostępnił go jako open-source, aby użytkownicy mogli przejrzeć i zweryfikować jego działanie. Ukłony dla autora. Korzystanie jest bezpłatne, jednak ponowna publikacja kodu podlega naszym Zasadom serwisu.
Wyłączenie odpowiedzialności
Informacje i publikacje nie stanowią i nie powinny być traktowane jako porady finansowe, inwestycyjne, tradingowe ani jakiekolwiek inne rekomendacje dostarczane lub zatwierdzone przez TradingView. Więcej informacji znajduje się w Warunkach użytkowania.