OPEN-SOURCE SCRIPT
Fences

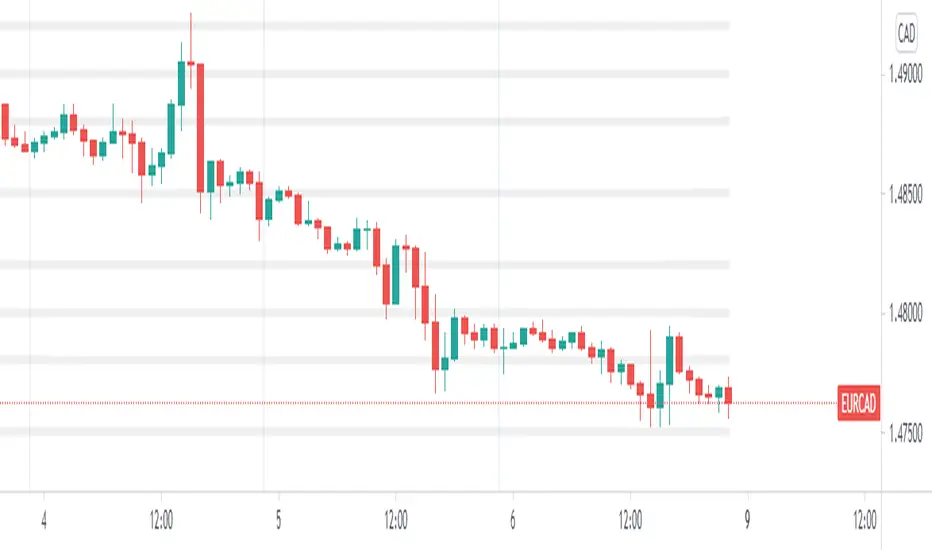
This is a simple script that plots horizontal grid on your chart using .x000 .x200 .x500 .x800 levels. Mike mentioned these levels in one of his videos.
Fences is only a semi-automatic indicator. You have to input the central point AND number of decimals yourself.
• Decimals are set to 3 but JPY pairs need it to be 1.
• Anchor point is the nearest level ending with three zeroes.
Fences is only a semi-automatic indicator. You have to input the central point AND number of decimals yourself.
• Decimals are set to 3 but JPY pairs need it to be 1.
• Anchor point is the nearest level ending with three zeroes.
Informacje o Wersji
A few visuals changed to look better on my charts.In addition, N1 N2 and N3 are now floats. So if you prefer 25 pip boxes as opposed to 200, 500, 800 levels, it is possible to set up now.
Skrypt open-source
W zgodzie z duchem TradingView twórca tego skryptu udostępnił go jako open-source, aby użytkownicy mogli przejrzeć i zweryfikować jego działanie. Ukłony dla autora. Korzystanie jest bezpłatne, jednak ponowna publikacja kodu podlega naszym Zasadom serwisu.
Wyłączenie odpowiedzialności
Informacje i publikacje nie stanowią i nie powinny być traktowane jako porady finansowe, inwestycyjne, tradingowe ani jakiekolwiek inne rekomendacje dostarczane lub zatwierdzone przez TradingView. Więcej informacji znajduje się w Warunkach użytkowania.