OPEN-SOURCE SCRIPT
EMA Cross Counter
EMA Cross Counter – Trend & Crossover Analyzer
🔥 Description
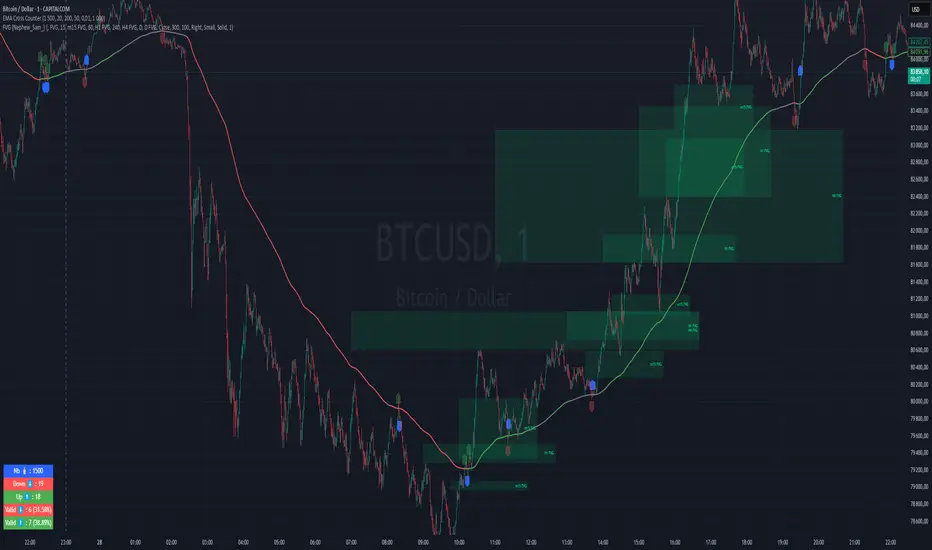
The EMA Cross Counter is an advanced indicator designed to detect price crossovers with the EMA 200 and provide insightful trend analysis. It highlights valid signals and displays success statistics directly on the chart.
🎯 Key Features
✅ Crossover Detection: Identifies moments when the price crosses the EMA 200 upward or downward.
✅ Signal Filtering: Valid signals (leading to sustained trends) are shown in blue, while invalid signals are faded.
✅ Performance Analysis: A statistics table shows the number of crossovers and their success rate.
✅ Dynamic EMA Coloring:
🟢 Green when the trend is bullish
🔴 Red when the trend is bearish
⚪ Gray when the market is in a range
✅ Range Detection: If the price remains within a narrow range for 30 candles, the EMA turns gray to indicate trend uncertainty.
✅ Stop-Loss (SL) Display: A dashed red line appears below sell signals and above buy signals (adjustable in pips).
✅ Automatic Alerts: Get notified when a significant crossover occurs.
📈 How to Use It?
1️⃣ Look for blue signals as potential trade entries.
2️⃣ Avoid trading when the EMA is gray (ranging market).
3️⃣ Use success rate statistics to evaluate crossover reliability.
4️⃣ Adjust SL distance in the settings to match your risk management strategy.
🛠 Customization Options
Adjustable EMA period
Configurable range threshold
SL distance customizable in pips
Enable/Disable alerts
💡 Ideal for scalping and swing trading, this indicator offers clear trend insights to enhance your decision-making process!
💬 Try it out and share your feedback! 🚀
🔥 Description
The EMA Cross Counter is an advanced indicator designed to detect price crossovers with the EMA 200 and provide insightful trend analysis. It highlights valid signals and displays success statistics directly on the chart.
🎯 Key Features
✅ Crossover Detection: Identifies moments when the price crosses the EMA 200 upward or downward.
✅ Signal Filtering: Valid signals (leading to sustained trends) are shown in blue, while invalid signals are faded.
✅ Performance Analysis: A statistics table shows the number of crossovers and their success rate.
✅ Dynamic EMA Coloring:
🟢 Green when the trend is bullish
🔴 Red when the trend is bearish
⚪ Gray when the market is in a range
✅ Range Detection: If the price remains within a narrow range for 30 candles, the EMA turns gray to indicate trend uncertainty.
✅ Stop-Loss (SL) Display: A dashed red line appears below sell signals and above buy signals (adjustable in pips).
✅ Automatic Alerts: Get notified when a significant crossover occurs.
📈 How to Use It?
1️⃣ Look for blue signals as potential trade entries.
2️⃣ Avoid trading when the EMA is gray (ranging market).
3️⃣ Use success rate statistics to evaluate crossover reliability.
4️⃣ Adjust SL distance in the settings to match your risk management strategy.
🛠 Customization Options
Adjustable EMA period
Configurable range threshold
SL distance customizable in pips
Enable/Disable alerts
💡 Ideal for scalping and swing trading, this indicator offers clear trend insights to enhance your decision-making process!
💬 Try it out and share your feedback! 🚀
Skrypt open-source
W zgodzie z duchem TradingView twórca tego skryptu udostępnił go jako open-source, aby użytkownicy mogli przejrzeć i zweryfikować jego działanie. Ukłony dla autora. Korzystanie jest bezpłatne, jednak ponowna publikacja kodu podlega naszym Zasadom serwisu.
Wyłączenie odpowiedzialności
Informacje i publikacje nie stanowią i nie powinny być traktowane jako porady finansowe, inwestycyjne, tradingowe ani jakiekolwiek inne rekomendacje dostarczane lub zatwierdzone przez TradingView. Więcej informacji znajduje się w Warunkach użytkowania.