OPEN-SOURCE SCRIPT
SPX vs VIX Risk-On / Risk-Off Toolkit [SB1]
SPX vs VIX Risk-On / Risk-Off Toolkit [SB1] — Indicator Description
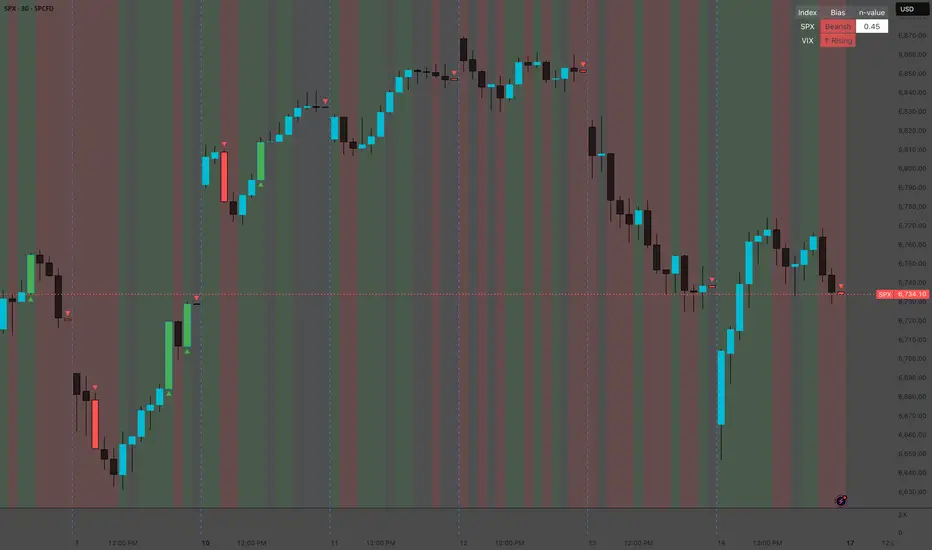
This toolkit provides a clear view of market sentiment by comparing the behavior of the S&P 500 Index (SPX) with the VIX volatility index. The goal is to identify when conditions align into Risk-On, Risk-Off, or Neutral states using objective price and volatility signals.
🔹 Core Logic
The indicator analyzes:
SPX Candle Direction
Each bar is classified as Bullish, Bearish, or Neutral based on SPX open/close behavior.
VIX Direction of Change
Falling VIX = easing volatility pressure
Rising VIX = increasing risk pressure
Market Alignment Conditions
Risk-On: SPX bullish + VIX falling
Risk-Off: SPX bearish + VIX rising
Neutral: Any non-aligned state
These conditions dynamically update with each bar and provide alerts when alignment changes.
🔹 Normalized Trend Strength (n-value)
The script measures SPX trend intensity using a normalized EMA-distance calculation:
Fast EMA vs Slow EMA
True Range–based ATR smoothing
n-value = EMA distance ÷ ATR
This metric helps identify strong, sustained directional moves regardless of volatility environment.
Alerts trigger when the n-value enters a user-defined trend-strength zone.
🔹 Movable Dashboard Display
A clean, compact dashboard displays:
SPX bias (Bullish / Bearish / Neutral)
SPX n-value (trend strength)
VIX direction (Rising / Falling / Flat)
You can place the dashboard in any corner of the chart.
🔹 VIX-Based Background Coloring
Optional background shading shows overall sentiment:
Green: Risk-On
Red: Risk-Off
Gray: Neutral
This makes the market backdrop instantly visible.
🔹 Strong Candle Detection
The script also identifies powerful SPX candles using strict criteria:
Candle body must exceed a minimum percentage of total range
Close must be near the high (for bullish) or near the low (for bearish)
Marks candles with triangles and can color the bars
Useful for spotting impulsive moves and continuation signals
Alerts also fire when a strong candle aligns with Risk-On or Risk-Off sentiment.
🔹 Full Alert Suite
Alerts include:
Risk-On alignment
Risk-Off alignment
Neutral/out-of-alignment
Strong Bull or Bear Candle + Sentiment confirmation
High-trend n-value conditions
This makes the indicator ready for automation or alert-based trading workflows.
📌 Summary
This SPX-focused sentiment engine blends:
Index trend behavior
Volatility pressure (VIX)
Normalized trend strength (n-value)
Strong candle confirmation
Visual dashboard
Smart alerts
It provides a structured, objective way to gauge market risk conditions and identify high-quality trend opportunities.
🆕 Update: Added Normalized Trend Strength (n-Value)
This update introduces a Normalized Trend Strength metric, displayed as a small numeric value next to each trend signal. It measures how strong the current trend is relative to market volatility.
How It Works
The n-value uses the difference between the Fast EMA and Slow EMA, divided by ATR:
n = | Fast EMA – Slow EMA | ÷ ATR
This transforms raw price movement into a volatility-adjusted trend strength score, making it easier to compare trend quality across different market conditions.
How to Read the n-Value
n-Value Meaning
< 0.10 No trend / Chop / Noise
0.10 – 0.30 Weak trend
0.30 – 0.60 Moderate trend
0.60 – 1.00 Strong trend
1.00+ Very strong momentum
Why It Matters
This addition helps you:
Filter weak signals
Confirm when a trend has real strength
Avoid low-quality setups
Spot strong momentum early
The n-value works automatically with your existing Fast/Slow EMA trend logic and appears inline with the trend label so you can evaluate signals at a glance.
Skrypt open-source
W zgodzie z duchem TradingView twórca tego skryptu udostępnił go jako open-source, aby użytkownicy mogli przejrzeć i zweryfikować jego działanie. Ukłony dla autora. Korzystanie jest bezpłatne, jednak ponowna publikacja kodu podlega naszym Zasadom serwisu.
Wyłączenie odpowiedzialności
Informacje i publikacje nie stanowią i nie powinny być traktowane jako porady finansowe, inwestycyjne, tradingowe ani jakiekolwiek inne rekomendacje dostarczane lub zatwierdzone przez TradingView. Więcej informacji znajduje się w Warunkach użytkowania.