OPEN-SOURCE SCRIPT
Super Indicator
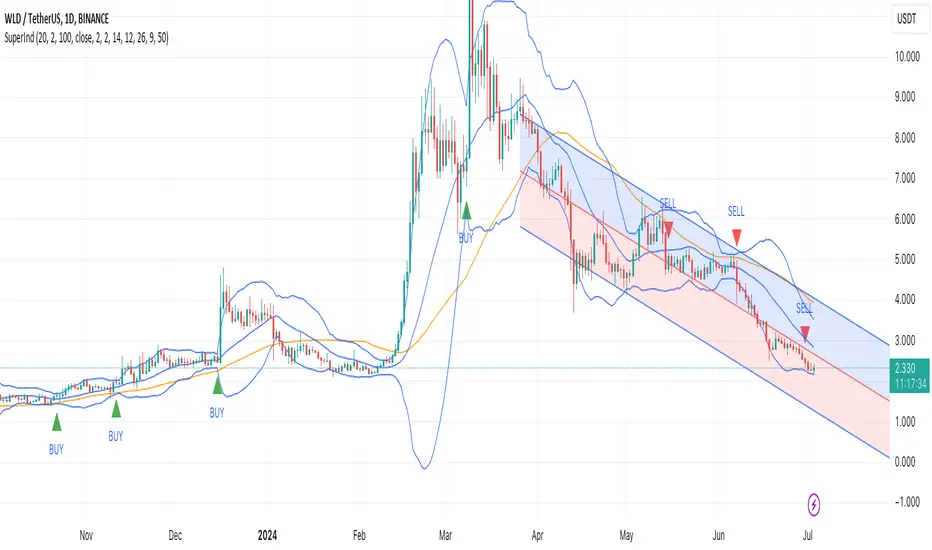
Overview of the Combined Indicator
This combined indicator leverages three major technical analysis tools:
Bollinger Bands
Linear Regression Channels
Scalping Strategy Indicators (RSI, MACD, SMA)
Each of these tools provides unique insights into market conditions, and their integration offers a comprehensive view of price movements, trends, and potential trading signals.
1. Bollinger Bands
Purpose:
Bollinger Bands are used to measure market volatility and identify overbought or oversold conditions.
Components:
Basis (Middle Band): Typically a 20-period Simple Moving Average (SMA).
Upper Band: Basis + (2 * Standard Deviation).
Lower Band: Basis - (2 * Standard Deviation).
Why They Complement:
Bollinger Bands expand and contract based on market volatility. When the bands are narrow, it indicates low volatility and potential for a significant move. Wide bands indicate high volatility. This helps traders gauge the strength of market moves and potential reversals.
2. Linear Regression Channels
Purpose:
Linear Regression Channels identify the overall trend direction and measure deviation from the mean price over a specific period.
Components:
Middle Line (Linear Regression Line): The line of best fit through the price data over a specified period.
Upper and Lower Lines: Channels created by adding/subtracting a multiple of the standard deviation or another deviation measure from the regression line.
Why They Complement:
Linear Regression Channels provide a clear visual representation of the trend direction and the range within which prices typically fluctuate. This can help traders identify trend continuations and reversals, making it easier to spot entry and exit points.
3. Scalping Strategy Indicators
Purpose:
The RSI, MACD, and SMA are used to generate short-term buy and sell signals, which are essential for scalping strategies aimed at capturing quick profits from small price movements.
Components:
RSI (Relative Strength Index): Measures the speed and change of price movements, typically over 14 periods. It helps identify overbought and oversold conditions.
MACD (Moving Average Convergence Divergence): Consists of the MACD line, Signal line, and histogram. It helps identify changes in the strength, direction, momentum, and duration of a trend.
SMA (Simple Moving Average): The average price over a specified period, used to smooth out price data and identify trends.
Why They Complement:
These indicators provide short-term signals that can confirm or refute the signals given by Bollinger Bands and Linear Regression Channels. For example, a buy signal might be more reliable if the price is near the lower Bollinger Band and the MACD crosses above its signal line.
How They Work Together
Scenario 1: Confirming Trend Continuations
Bollinger Bands: Price staying near the upper band suggests a strong uptrend.
Linear Regression Channels: Price staying above the middle line confirms the uptrend.
5-Minute Scalping Strategy: RSI not in overbought territory, and MACD showing bullish momentum confirms continuation.
Scenario 2: Identifying Reversals
Bollinger Bands: Price touching or moving outside the lower band suggests oversold conditions.
Linear Regression Channels: Price at the lower channel line indicates potential support.
5-Minute Scalping Strategy: RSI in oversold territory, and MACD showing a bullish crossover indicates a reversal.
Scenario 3: Volatility Breakouts
Bollinger Bands: Bands contracting indicates low volatility and potential breakout.
Linear Regression Channels: Price moving away from the middle line signals potential breakout direction.
Scalping Strategy: MACD and RSI confirming the breakout direction for entry.
Input Parameters:
Define settings for Bollinger Bands, Linear Regression Channels, and the scalping strategy.
Allow users to customize lengths, multipliers, and colors.
Bollinger Bands Calculation:
Calculate the basis (SMA) and standard deviation.
Derive the upper and lower bands from the basis and standard deviation.
Linear Regression Channel Calculation:
Compute the slope, average, and intercept of the linear regression line.
Calculate deviations to plot upper and lower channel lines.
5-Minute Scalping Strategy:
Calculate RSI, MACD, and SMA for short-term trend analysis.
Define buy and sell conditions based on these indicators.
Plotting and Alerts:
Plot Bollinger Bands and Linear Regression Channels on the chart.
Plot buy and sell signals with shapes.
Set alerts for key conditions like exiting the regression channel bounds and trend switches.
Conclusion
By combining Bollinger Bands, Linear Regression Channels, and a 5-minute scalping strategy, this indicator offers a robust tool for traders. Bollinger Bands provide volatility insights, Linear Regression Channels highlight trend direction and potential reversals, and the scalping strategy offers precise entry and exit points. Together, these tools can enhance a trader's ability to make informed decisions in various market conditions.
Skrypt open-source
W zgodzie z duchem TradingView twórca tego skryptu udostępnił go jako open-source, aby użytkownicy mogli przejrzeć i zweryfikować jego działanie. Ukłony dla autora. Korzystanie jest bezpłatne, jednak ponowna publikacja kodu podlega naszym Zasadom serwisu.
Wyłączenie odpowiedzialności
Informacje i publikacje nie stanowią i nie powinny być traktowane jako porady finansowe, inwestycyjne, tradingowe ani jakiekolwiek inne rekomendacje dostarczane lub zatwierdzone przez TradingView. Więcej informacji znajduje się w Warunkach użytkowania.