OPEN-SOURCE SCRIPT
Zaktualizowano Volume Profile per day with support/resistance lines
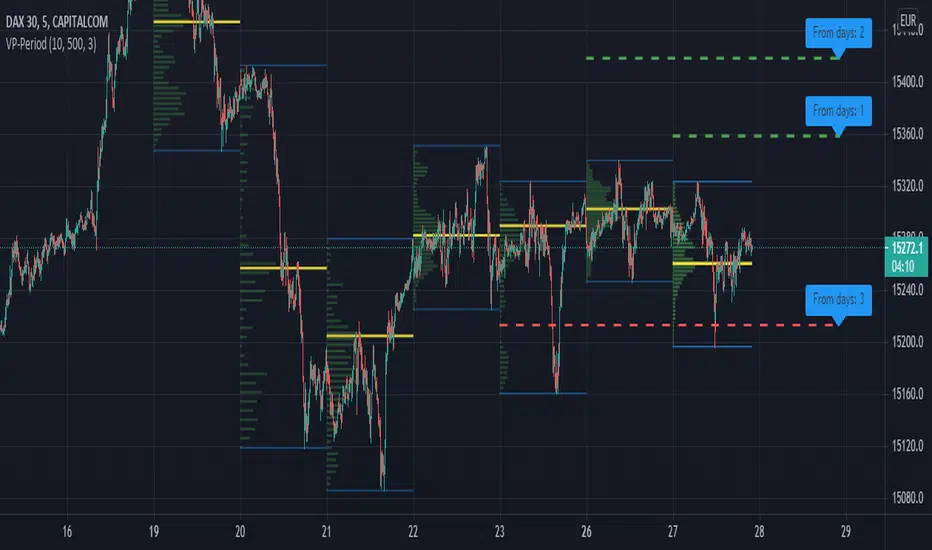
This indicator shows the volume profile by daily blocks and draws on the chart the support or resistance lines produced by the previous volume profile block. A support line will be created if in the previous block, the VPOC line was closer to the lowest price line of that block. This support line will be placed below the VPOC line, at a distance equal to the difference between the highest price of that block and the VPOC price. For the case of the resistance line, the logic applied is analogous.
These support and resistance lines are introduced because, according to the Gaussian bell, the VPOC is likely to be located in the middle, and these deviations can be used to trace support and resistance.
In addition, the indicator includes the following features:
- Change the colors of all plotted lines.
- Define the number of daily blocks to be displayed.
- Define the resolution when calculating the volume of each candle.
- Define the number of support/resistance lines to be displayed.
- Highest and lowest price lines, as well as vpoc line, volume histogram and support and resistance lines.
- Display or not, the vpoc line and the volume histogram.
The calculations performed by the script improve if the candles used are of a lower timeframe. This indicator has been tested in several markets, including cryptos, CFDs, Forex and Indices.
Informacje o Wersji
Added offset for labels and for support and resistance lines so that they do not overlap with the bars on the chart.Informacje o Wersji
It is now possible to show and hide chart lines and labels separately.Skrypt open-source
W zgodzie z duchem TradingView twórca tego skryptu udostępnił go jako open-source, aby użytkownicy mogli przejrzeć i zweryfikować jego działanie. Ukłony dla autora. Korzystanie jest bezpłatne, jednak ponowna publikacja kodu podlega naszym Zasadom serwisu.
Wyłączenie odpowiedzialności
Informacje i publikacje nie stanowią i nie powinny być traktowane jako porady finansowe, inwestycyjne, tradingowe ani jakiekolwiek inne rekomendacje dostarczane lub zatwierdzone przez TradingView. Więcej informacji znajduje się w Warunkach użytkowania.
Skrypt open-source
W zgodzie z duchem TradingView twórca tego skryptu udostępnił go jako open-source, aby użytkownicy mogli przejrzeć i zweryfikować jego działanie. Ukłony dla autora. Korzystanie jest bezpłatne, jednak ponowna publikacja kodu podlega naszym Zasadom serwisu.
Wyłączenie odpowiedzialności
Informacje i publikacje nie stanowią i nie powinny być traktowane jako porady finansowe, inwestycyjne, tradingowe ani jakiekolwiek inne rekomendacje dostarczane lub zatwierdzone przez TradingView. Więcej informacji znajduje się w Warunkach użytkowania.