OPEN-SOURCE SCRIPT
Zaktualizowano Compound Value @ annual rate
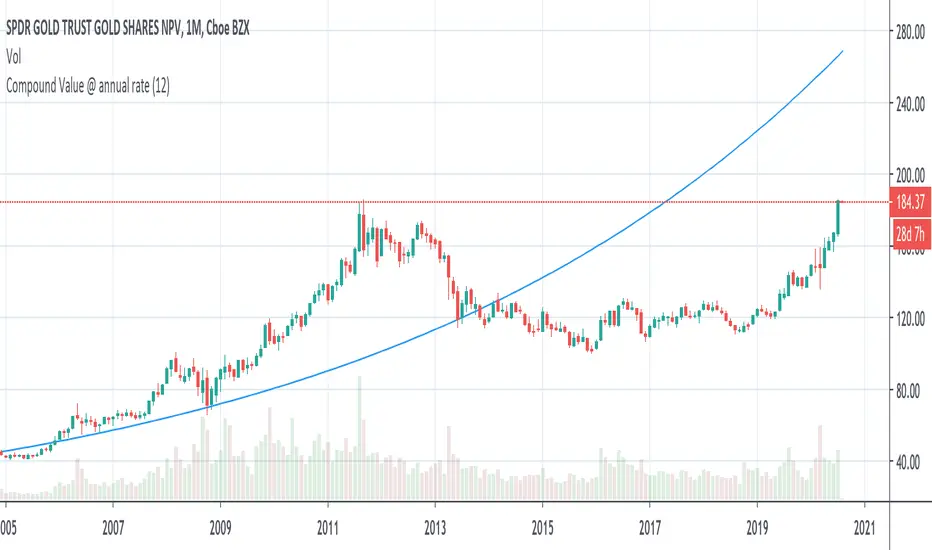
By studying historical data we can know the compounded growth rate of an investment from the inception date. For example if we know that an investment has grown at the rate of 6% in the past and if we expect similar growth in the future also, We can plot this graph to understand whether the current price is underpriced or overpriced as per projected return.
In this graph, it takes the initial close price as a principle and rate from the input and calculates the compound amount at each interval.
In this graph, it takes the initial close price as a principle and rate from the input and calculates the compound amount at each interval.
Informacje o Wersji
Author changeInformacje o Wersji
Updated input data type for rateSkrypt open-source
W zgodzie z duchem TradingView twórca tego skryptu udostępnił go jako open-source, aby użytkownicy mogli przejrzeć i zweryfikować jego działanie. Ukłony dla autora. Korzystanie jest bezpłatne, jednak ponowna publikacja kodu podlega naszym Zasadom serwisu.
Wyłączenie odpowiedzialności
Informacje i publikacje nie stanowią i nie powinny być traktowane jako porady finansowe, inwestycyjne, tradingowe ani jakiekolwiek inne rekomendacje dostarczane lub zatwierdzone przez TradingView. Więcej informacji znajduje się w Warunkach użytkowania.
Skrypt open-source
W zgodzie z duchem TradingView twórca tego skryptu udostępnił go jako open-source, aby użytkownicy mogli przejrzeć i zweryfikować jego działanie. Ukłony dla autora. Korzystanie jest bezpłatne, jednak ponowna publikacja kodu podlega naszym Zasadom serwisu.
Wyłączenie odpowiedzialności
Informacje i publikacje nie stanowią i nie powinny być traktowane jako porady finansowe, inwestycyjne, tradingowe ani jakiekolwiek inne rekomendacje dostarczane lub zatwierdzone przez TradingView. Więcej informacji znajduje się w Warunkach użytkowania.