OPEN-SOURCE SCRIPT
Interval — full-screen verticals + H/L + metrics (robust v6)
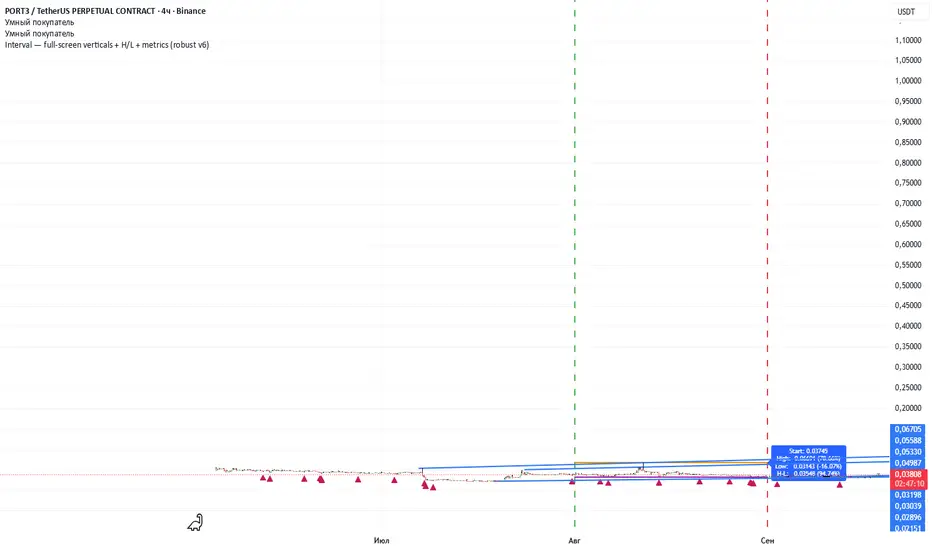
Specify the start date of the analysis and the end date of the analysis, after which 2 vertical lines will appear, the extremes in this period will be marked, and the percentage of deviations will be shown. Next, you can switch assets and see how they behave over the same time interval.
Skrypt open-source
W zgodzie z duchem TradingView twórca tego skryptu udostępnił go jako open-source, aby użytkownicy mogli przejrzeć i zweryfikować jego działanie. Ukłony dla autora. Korzystanie jest bezpłatne, jednak ponowna publikacja kodu podlega naszym Zasadom serwisu.
Wyłączenie odpowiedzialności
Informacje i publikacje nie stanowią i nie powinny być traktowane jako porady finansowe, inwestycyjne, tradingowe ani jakiekolwiek inne rekomendacje dostarczane lub zatwierdzone przez TradingView. Więcej informacji znajduje się w Warunkach użytkowania.