OPEN-SOURCE SCRIPT
Zaktualizowano Average Candle Range [UkutaLabs]
█ OVERVIEW
The Average Candle Range is a powerful indicator that compares the size of the current bar to past bars. This comparison can be used in a wide variety of trading strategies, allowing traders to understand at a glance the relative size of each candle.
█ USAGE
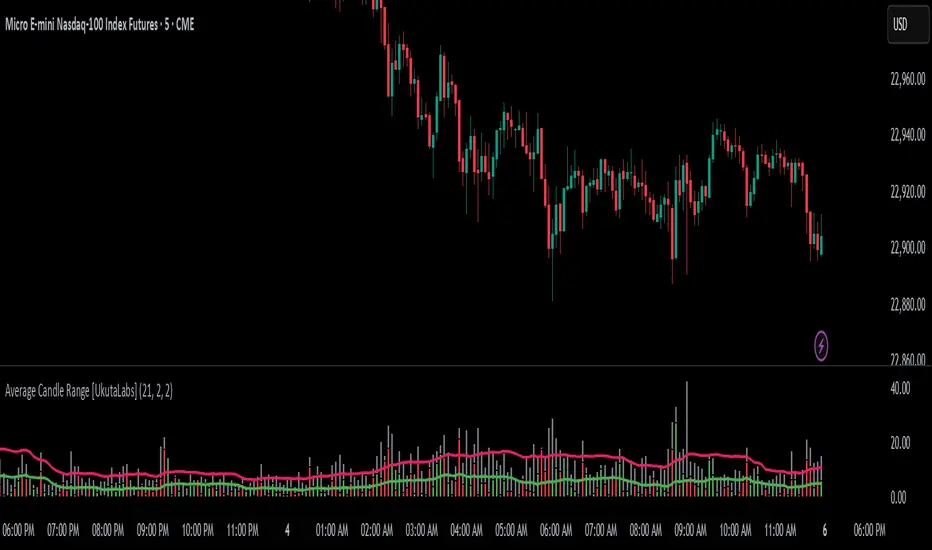
As each candlestick forms, two bars will be plotted on the indicator. The grey bar represents the total range of the candle from the high to the low, and the second bar represents the body of the bar from the open to the close. Depending on whether the bar is bullish or bearish, the second bar will be colored green or red respectively.
Two averages will also be drawn over these bars that represent the average size of the two bar types over a period that is specified by the user. These averages can be toggled in the indicator settings.
█ SETTINGS
Configuration
• Period: Determines how many bars to use in the calculation of the averages.
• Show Bar Average: Determines whether or not the average for the full bar size is displayed.
• Show Body Average: Determines whether or not the average for the body is displayed.
The Average Candle Range is a powerful indicator that compares the size of the current bar to past bars. This comparison can be used in a wide variety of trading strategies, allowing traders to understand at a glance the relative size of each candle.
█ USAGE
As each candlestick forms, two bars will be plotted on the indicator. The grey bar represents the total range of the candle from the high to the low, and the second bar represents the body of the bar from the open to the close. Depending on whether the bar is bullish or bearish, the second bar will be colored green or red respectively.
Two averages will also be drawn over these bars that represent the average size of the two bar types over a period that is specified by the user. These averages can be toggled in the indicator settings.
█ SETTINGS
Configuration
• Period: Determines how many bars to use in the calculation of the averages.
• Show Bar Average: Determines whether or not the average for the full bar size is displayed.
• Show Body Average: Determines whether or not the average for the body is displayed.
Informacje o Wersji
Added ability to customize the 'Averages' lines - color and size.Skrypt open-source
W zgodzie z duchem TradingView twórca tego skryptu udostępnił go jako open-source, aby użytkownicy mogli przejrzeć i zweryfikować jego działanie. Ukłony dla autora. Korzystanie jest bezpłatne, jednak ponowna publikacja kodu podlega naszym Zasadom serwisu.
Wyłączenie odpowiedzialności
Informacje i publikacje nie stanowią i nie powinny być traktowane jako porady finansowe, inwestycyjne, tradingowe ani jakiekolwiek inne rekomendacje dostarczane lub zatwierdzone przez TradingView. Więcej informacji znajduje się w Warunkach użytkowania.
Skrypt open-source
W zgodzie z duchem TradingView twórca tego skryptu udostępnił go jako open-source, aby użytkownicy mogli przejrzeć i zweryfikować jego działanie. Ukłony dla autora. Korzystanie jest bezpłatne, jednak ponowna publikacja kodu podlega naszym Zasadom serwisu.
Wyłączenie odpowiedzialności
Informacje i publikacje nie stanowią i nie powinny być traktowane jako porady finansowe, inwestycyjne, tradingowe ani jakiekolwiek inne rekomendacje dostarczane lub zatwierdzone przez TradingView. Więcej informacji znajduje się w Warunkach użytkowania.