OPEN-SOURCE SCRIPT
Zaktualizowano YCGH Drawdown Percentiles
What This Indicator Does?
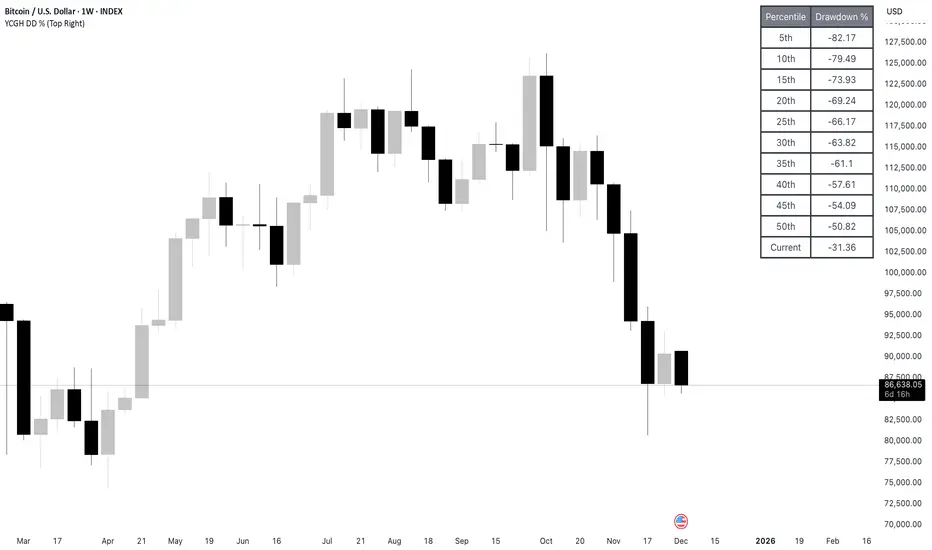
The Drawdown Percentiles indicator tracks how far below the all-time high (ATH) a stock or asset is currently trading, then displays statistical percentiles of historical drawdowns in a customizable table.
Percentile Analysis: It collects up to 5,000 historical bars of drawdown data, sorts them, and calculates user-selected percentiles (default: 10th, 30th, 50th) to show where current drawdowns rank historically.
Visual Display: A table shows each percentile threshold with color-coded drawdown values, helping you quickly assess whether the current drawdown is typical or extreme compared to historical patterns.
Practical Use Cases
Risk Assessment: Identify if current drawdowns fall within normal ranges or represent extreme conditions requiring position adjustments.
Entry/Exit Timing: Use percentile rankings to time entries during historically shallow drawdowns (better conditions) and reduce exposure during deep drawdowns.
Strategy Comparison: Compare drawdown patterns across different assets or trading strategies to evaluate risk-adjusted performance.
Informacje o Wersji
updated tableInformacje o Wersji
logic updatedInformacje o Wersji
updated TableInformacje o Wersji
removed linesInformacje o Wersji
table made fancyInformacje o Wersji
Summary of Functional Changes:Fixed 10 percentiles instead of 3 customizable ones
Complete percentile calculation logic that actually works
Full table border on all sides (frame)
Individual color customization for each percentile level
Current drawdown display as the last row
Visual ATH reference on the chart
Proper data storage in array for historical analysis
Skrypt open-source
W zgodzie z duchem TradingView twórca tego skryptu udostępnił go jako open-source, aby użytkownicy mogli przejrzeć i zweryfikować jego działanie. Ukłony dla autora. Korzystanie jest bezpłatne, jednak ponowna publikacja kodu podlega naszym Zasadom serwisu.
YCGH Capital
Wyłączenie odpowiedzialności
Informacje i publikacje nie stanowią i nie powinny być traktowane jako porady finansowe, inwestycyjne, tradingowe ani jakiekolwiek inne rekomendacje dostarczane lub zatwierdzone przez TradingView. Więcej informacji znajduje się w Warunkach użytkowania.