OPEN-SOURCE SCRIPT
Adjusted Directional Movement @shrilss

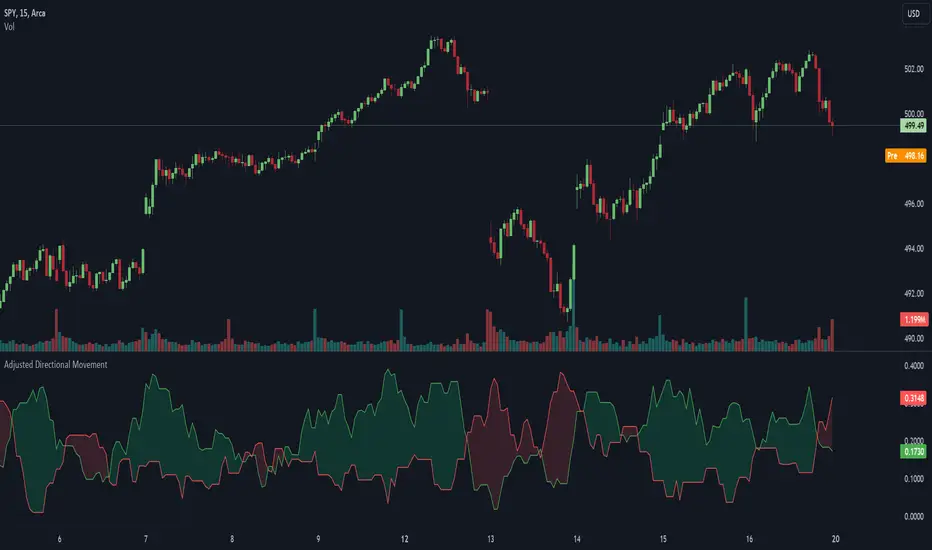
This indicator combines elements of the Average True Range (ATR) and the Directional Movement Index (DMI) to create adjusted directional lines.
The core of this indicator lies in its calculation of the Adjusted Directional Movement (ADM), which provides a refined measure of price movement. Unlike traditional ATR calculations, which solely rely on the high-low range of each period, the ADM considers additional factors such as the current close relative to the previous close. This adjustment helps to capture more accurately the true extent of price movement.
To calculate the ADM, the script first computes the True Range (TR), which represents the maximum of three values: the current high minus low, the absolute value of the current high minus the previous close, and the absolute value of the current low minus the previous close. This TR value serves as the basis for determining price movement.
Next, the script calculates the Adjusted Directional Movement (ADM) by comparing the current high-low range with the range from the previous period. Positive ADM (Plus ADM) is computed as the maximum of the current high minus the previous high or zero, while negative ADM (Minus ADM) is calculated as the maximum of the previous low minus the current low or zero.
Once the Plus ADM and Minus ADM values are obtained, they are normalized by dividing them by the True Range. This normalization process ensures that the directional lines accurately reflect the proportion of price movement relative to the overall range.
Finally, the script smoothes out these directional lines over a specified length using a simple moving average calculation. The resulting Plus Directional Line (+DI) and Minus Directional Line (-DI) provide insights into the strength and direction of price movement.
Visually, the script plots the +DI and -DI lines on the chart, with a shaded region indicating which line is dominant at any given time. This shading helps traders quickly assess the prevailing trend direction.
Skrypt open-source
W zgodzie z duchem TradingView twórca tego skryptu udostępnił go jako open-source, aby użytkownicy mogli przejrzeć i zweryfikować jego działanie. Ukłony dla autora. Korzystanie jest bezpłatne, jednak ponowna publikacja kodu podlega naszym Zasadom serwisu.
Wyłączenie odpowiedzialności
Informacje i publikacje nie stanowią i nie powinny być traktowane jako porady finansowe, inwestycyjne, tradingowe ani jakiekolwiek inne rekomendacje dostarczane lub zatwierdzone przez TradingView. Więcej informacji znajduje się w Warunkach użytkowania.