OPEN-SOURCE SCRIPT
Zaktualizowano RM Timeframe Continuity

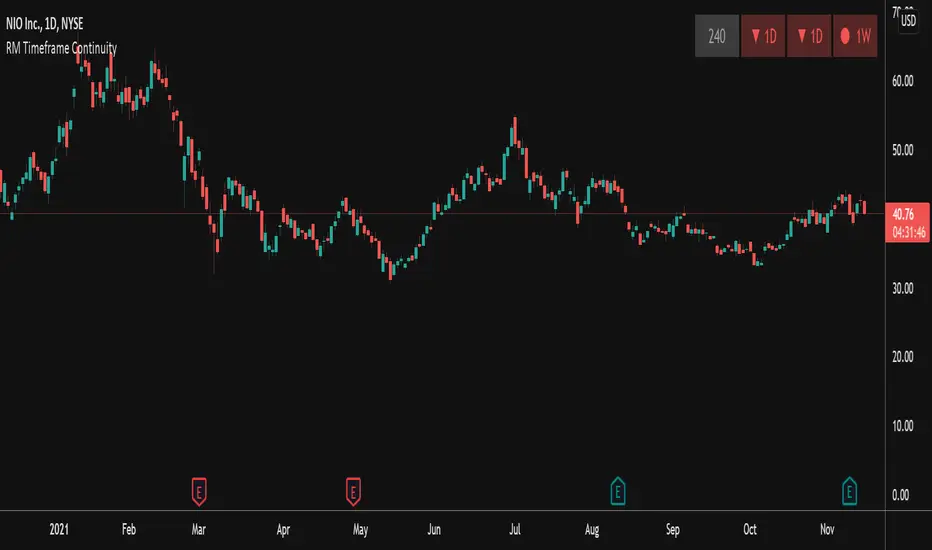
This indicator plots a table off to the right of the chart to help with determining timeframe continuity. Per the Strat, a great edge is only taking trades where full timeframe continuity is in place (i.e. if you are going long, make sure other timeframes are also green).
In this script:
User defined options:
In this script:
- Green candles have green colored boxes, red candles have red colored boxes.
- Inside bars are represented by a circle - ⬤
- Outside bars are represented by a tall rectangle - ▮
- 2-up bars are indicated by an up arrow - ▲
- 2-down bars are indicated by a down arrow - ▼
User defined options:
- Pick any timeframe for the 4 boxes
- Choose whether to plot the highs/lows of the larger timeframe candles as horizontal rays on your chart (along with the associated colors)
Informacje o Wersji
Fixing a bug with the glyphs of the 4th box.Skrypt open-source
W zgodzie z duchem TradingView twórca tego skryptu udostępnił go jako open-source, aby użytkownicy mogli przejrzeć i zweryfikować jego działanie. Ukłony dla autora. Korzystanie jest bezpłatne, jednak ponowna publikacja kodu podlega naszym Zasadom serwisu.
Wyłączenie odpowiedzialności
Informacje i publikacje nie stanowią i nie powinny być traktowane jako porady finansowe, inwestycyjne, tradingowe ani jakiekolwiek inne rekomendacje dostarczane lub zatwierdzone przez TradingView. Więcej informacji znajduje się w Warunkach użytkowania.
Skrypt open-source
W zgodzie z duchem TradingView twórca tego skryptu udostępnił go jako open-source, aby użytkownicy mogli przejrzeć i zweryfikować jego działanie. Ukłony dla autora. Korzystanie jest bezpłatne, jednak ponowna publikacja kodu podlega naszym Zasadom serwisu.
Wyłączenie odpowiedzialności
Informacje i publikacje nie stanowią i nie powinny być traktowane jako porady finansowe, inwestycyjne, tradingowe ani jakiekolwiek inne rekomendacje dostarczane lub zatwierdzone przez TradingView. Więcej informacji znajduje się w Warunkach użytkowania.