PROTECTED SOURCE SCRIPT
Zaktualizowano Smart Bottom Signal
This indicator is used to find temporary bottoms that are validated with a subsequent candle that closes above the high. The indicator is based on elliott wave theory and tries to signal entries on wave lows. It triggers off of code from "[Void] TD D-Wave" 0, 2, 4, A, and C bull wave lows by finding a candle with a close higher that the high of the lowest wave candle or the high of a bullish candle that first breaks above the 8EMA. Green arrows will plot on close indicating that the indicator was triggered.
There are 3 options for display of plots provided:
ShowSmartSigs - This is defaulted to true (display) and allows users to toggle the green arrow alert plots on/off that appear below the candle when triggered.
ShowOnOffPlots - This is logic I use to signal a downturn/upturn and is indicated by red/green arrows appearing above the trigger candle.
ShowBounceSigs - This is defaulted to false and would show as an orange arrow under a candle where a bullish candle first climbs above the 8EMA when ShowOnOffPlots is signaling a downturn and SlowtSochastics is below 21. The SlowStochastics settings are adjustable on the settings screen and default to 21,3.
Alerts Available:
"Smart Buy Bounce" - This alert fires when the ShowSmartSigs signal is triggered.
"Buy Bounce" - This alert fires when the ShowBounceSigs signal is triggered.
"Turn Off Bots"/"Turn On Bots" - This alert fires when the ShowOnOffPlots signals are triggered. I use this to turn off shorter timeframe (15m-1H) bots during a prolonged price drop.
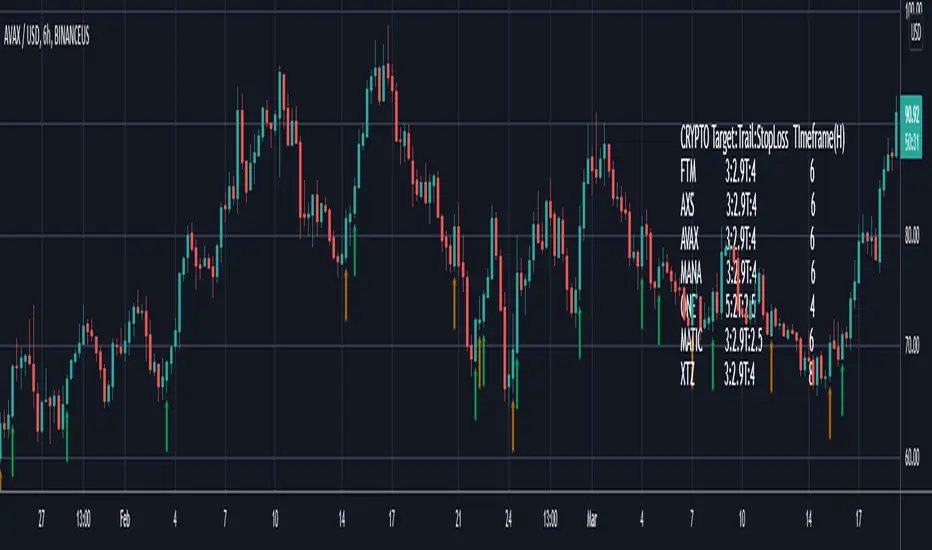
This is an early prototype that is filtered to the following tested cryptos against the specified chart timeframes and using the expressed target/trail/stoploss logic.
CRYPTO Target:Trail:StopLoss TImeframe(H)
FTM 3:2.9T:4 6
AXS 3:2.9T:4 6
AVAX 3:2.9T:4 6
MANA 3:2.9T:4 6
ONE 5:2T:2.5 4
MATIC 3:2.9T:2.5 6
XTZ 3:2.9T:4 8
There are 3 options for display of plots provided:
ShowSmartSigs - This is defaulted to true (display) and allows users to toggle the green arrow alert plots on/off that appear below the candle when triggered.
ShowOnOffPlots - This is logic I use to signal a downturn/upturn and is indicated by red/green arrows appearing above the trigger candle.
ShowBounceSigs - This is defaulted to false and would show as an orange arrow under a candle where a bullish candle first climbs above the 8EMA when ShowOnOffPlots is signaling a downturn and SlowtSochastics is below 21. The SlowStochastics settings are adjustable on the settings screen and default to 21,3.
Alerts Available:
"Smart Buy Bounce" - This alert fires when the ShowSmartSigs signal is triggered.
"Buy Bounce" - This alert fires when the ShowBounceSigs signal is triggered.
"Turn Off Bots"/"Turn On Bots" - This alert fires when the ShowOnOffPlots signals are triggered. I use this to turn off shorter timeframe (15m-1H) bots during a prolonged price drop.
This is an early prototype that is filtered to the following tested cryptos against the specified chart timeframes and using the expressed target/trail/stoploss logic.
CRYPTO Target:Trail:StopLoss TImeframe(H)
FTM 3:2.9T:4 6
AXS 3:2.9T:4 6
AVAX 3:2.9T:4 6
MANA 3:2.9T:4 6
ONE 5:2T:2.5 4
MATIC 3:2.9T:2.5 6
XTZ 3:2.9T:4 8
Informacje o Wersji
This update removes the symbol and timeframe filters so that any symbol on any timeframe will work with this indicator. I use this with 3Commas for crypto trading 1, 4, 6, and 8 hour timeframes. I also added additional alerts for bullish wave 0 signals and bull trend signals. Overlay TD D-Wave (google the indicator) to see the wave counts. the bull trend alert fire when a signal triggers on a candle that had a high above the 200 EMA. The theory behind these alerts is that when using smaller timeframes like the 1H, there a lot of false signals and wave 0 is a more exhausted price state giving a higher chance of an oversold bounce. One the bull trend is established, the other wave count signals become more accurate. DYOR! By that I mean there are orange and green plots below the candles where the signals come in, so look at how the indicator performs on the symbol/timeframe combo before trusting it for trading.Skrypt chroniony
Ten skrypt został opublikowany jako zamknięty kod źródłowy. Można z tego korzystać swobodnie i bez żadnych ograniczeń — więcej informacji znajduje się tutaj.
Wyłączenie odpowiedzialności
Informacje i publikacje nie stanowią i nie powinny być traktowane jako porady finansowe, inwestycyjne, tradingowe ani jakiekolwiek inne rekomendacje dostarczane lub zatwierdzone przez TradingView. Więcej informacji znajduje się w Warunkach użytkowania.
Skrypt chroniony
Ten skrypt został opublikowany jako zamknięty kod źródłowy. Można z tego korzystać swobodnie i bez żadnych ograniczeń — więcej informacji znajduje się tutaj.
Wyłączenie odpowiedzialności
Informacje i publikacje nie stanowią i nie powinny być traktowane jako porady finansowe, inwestycyjne, tradingowe ani jakiekolwiek inne rekomendacje dostarczane lub zatwierdzone przez TradingView. Więcej informacji znajduje się w Warunkach użytkowania.