OPEN-SOURCE SCRIPT
Zaktualizowano Candle Information Panel
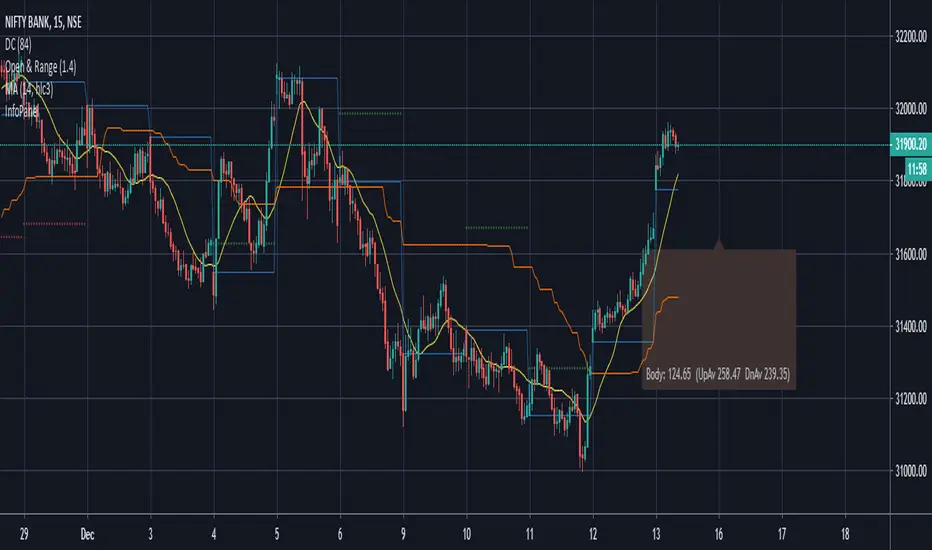
//This indicator shows Day's candle measurements with past averages. First column shows the candle details for the present day.
//"Open - Low", "High - Open", "Range(=High-low)", "Body(open-close)"
//Averages are calculated for occurences of Green and Red days. Up Averages are for Green days and Down Averages are for Red days.
//Average are not perfect calculations since occurences(of Red or Green) will vary within the timespan used for averages.
//This can used to guage general sense of probability of the price movement.
//e.g. if the Open to Low for a day exceeds UpAv value, then there is higher likelihood of day being Red.
//similarly, trade can be held in expectation of price reaching the DnAv and stop loss can be trailed accordingly.
//Not a perfect system. But something to work on further to increase price action understanding.
//Be careful on days where consecutive 3rd Highest High or Lowest Low day is made and also on the next day after such day. Prices may turn direction at least for a short while.
Complete Credit goes to PineCoders who gave me the main script on tradingview chat room.
Informacje o Wersji
Revision 1 - Corrected formula for body calculation.Skrypt open-source
W zgodzie z duchem TradingView twórca tego skryptu udostępnił go jako open-source, aby użytkownicy mogli przejrzeć i zweryfikować jego działanie. Ukłony dla autora. Korzystanie jest bezpłatne, jednak ponowna publikacja kodu podlega naszym Zasadom serwisu.
Wyłączenie odpowiedzialności
Informacje i publikacje nie stanowią i nie powinny być traktowane jako porady finansowe, inwestycyjne, tradingowe ani jakiekolwiek inne rekomendacje dostarczane lub zatwierdzone przez TradingView. Więcej informacji znajduje się w Warunkach użytkowania.
Skrypt open-source
W zgodzie z duchem TradingView twórca tego skryptu udostępnił go jako open-source, aby użytkownicy mogli przejrzeć i zweryfikować jego działanie. Ukłony dla autora. Korzystanie jest bezpłatne, jednak ponowna publikacja kodu podlega naszym Zasadom serwisu.
Wyłączenie odpowiedzialności
Informacje i publikacje nie stanowią i nie powinny być traktowane jako porady finansowe, inwestycyjne, tradingowe ani jakiekolwiek inne rekomendacje dostarczane lub zatwierdzone przez TradingView. Więcej informacji znajduje się w Warunkach użytkowania.