OPEN-SOURCE SCRIPT
Zaktualizowano Key Session Levels | Highs, Lows, Opens

Overview
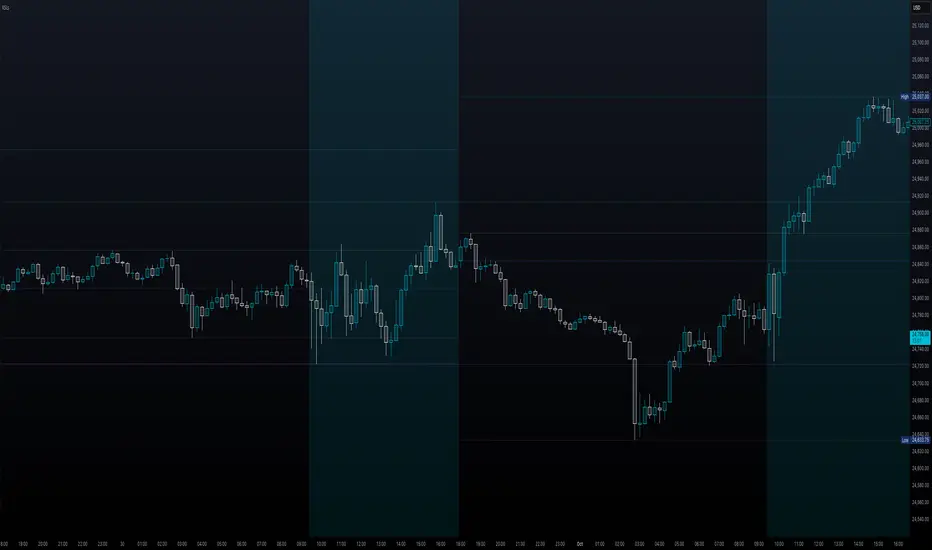
Designed for scalping and intraday trading on ES, NQ, and other futures markets that trade around the clock, this indicator automatically plots key support/resistance levels:
Session Definitions (America/New_York Time)
Session (18:00 - 16:59 ET)
Overnight Session (18:00 - 9:30 ET)
NY Session (9:30 - 16:59 ET)
Key Features
Flexible Extension Modes
Smart Line Management
Full Customization
Common Use Cases
Strategy
Best Timeframes
Works on any intraday timeframe, optimized for: 1m, 5m, 15m, 30m, 1H
Notes
Designed for scalping and intraday trading on ES, NQ, and other futures markets that trade around the clock, this indicator automatically plots key support/resistance levels:
- Session opens
- Session highs
- Session lows
- Overnight highs
- Overnight lows
Session Definitions (America/New_York Time)
Session (18:00 - 16:59 ET)
- Tracks complete trading cycle
- Plots: High, Low
- Represents true daily extremes of each session
Overnight Session (18:00 - 9:30 ET)
- Captures Asian and European session price action
- Plots: Open, High, Low
- These levels can act as support/resistance during the NY session
NY Session (9:30 - 16:59 ET)
- Optional background highlight for regular trading hours
- Helps visually distinguish active NY session from overnight action
Key Features
Flexible Extension Modes
- Same Day: Lines end at session close
- Next Day: Lines extend through the following session
- Full Chart: Lines extend indefinitely to the right
Smart Line Management
- Optional extension of overnight levels through NY session
- Control how many historical sessions to display (1-250)
- Automatic cleanup of old lines
Full Customization
- Individual color control for each level
- Line style options (solid, dotted, dashed)
- Line width adjustment (1px-4px)
- Show/hide any level independently
Common Use Cases
- Support/Resistance
- Breakout/Break & Retest
Strategy
- Wait for price to reach a key level
- Use Level 2 data to determine who's in control at the level (e.g. aggressive buyers vs. passive sellers) *this requires third-party software and a live data feed
- Enter long/short WITH institutional players, identified via Level 2 data
- Target areas/levels where the market may reverse
Best Timeframes
Works on any intraday timeframe, optimized for: 1m, 5m, 15m, 30m, 1H
Notes
- All times are in America/New_York (Eastern Time)
- Requires intraday timeframe to detect specific session times
- Lines are semi-transparent by default for better chart visibility
Informacje o Wersji
OverviewDesigned for scalping and intraday trading on ES, NQ, and other futures markets that trade around the clock, this indicator automatically plots key support/resistance levels:
- Session opens
- Session highs
- Session lows
- Overnight highs
- Overnight lows
Session Definitions (America/New_York Time)
Session (18:00 - 16:59 ET)
- Tracks complete trading cycle
- Plots: High, Low
- Represents true daily extremes of each session
Overnight Session (18:00 - 9:30 ET)
- Captures Asian and European session price action
- Plots: Open, High, Low
- These levels can act as support/resistance during the NY session
NY Session (9:30 - 16:59 ET)
- Optional background highlight for regular trading hours
- Helps visually distinguish active NY session from overnight action
Key Features
Flexible Extension Modes
- Same Day: Lines end at session close
- Next Day: Lines extend through the following session
- Full Chart: Lines extend indefinitely to the right
Smart Line Management
- Optional extension of overnight levels through NY session
- Control how many historical sessions to display (1-250)
- Automatic cleanup of old lines
Full Customization
- Individual color control for each level
- Line style options (solid, dotted, dashed)
- Line width adjustment (1px-4px)
- Show/hide any level independently
Common Use Cases
- Support/Resistance
- Breakout/Break & Retest
Strategy
- Wait for price to reach a key level
- Use Level 2 data to determine who's in control at the level (e.g. aggressive buyers vs. passive sellers) *this requires third-party software and a live data feed
- Enter long/short WITH institutional players, identified via Level 2 data
- Target areas/levels where the market may reverse
Best Timeframes
Works on any intraday timeframe, optimized for: 1m, 5m, 15m, 30m, 1H
Notes
- All times are in America/New_York (Eastern Time)
- Requires intraday timeframe to detect specific session times
- Lines are semi-transparent by default for better chart visibility
Changelog
V 1.1
Updated overnight session calculation; now accurately plots overnight high and low on timeframes above 1m.
Informacje o Wersji
V 1.1Updated overnight session calculation; now accurately plots overnight high and low on timeframes ab
Informacje o Wersji
v1.2Updated session calculation; now accurately shows session high and low on timeframes above 1m.
Informacje o Wersji
v1.3Added realtime overnight session high and low plotting.
Informacje o Wersji
v1.3.1Updated indicator name for SEO.
Skrypt open-source
W duchu TradingView twórca tego skryptu udostępnił go jako open-source, aby traderzy mogli analizować i weryfikować jego funkcjonalność. Brawo dla autora! Możesz korzystać z niego za darmo, ale pamiętaj, że ponowna publikacja kodu podlega naszym Zasadom Społeczności.
Wyłączenie odpowiedzialności
Informacje i publikacje przygotowane przez TradingView lub jego użytkowników, prezentowane na tej stronie, nie stanowią rekomendacji ani porad handlowych, inwestycyjnych i finansowych i nie powinny być w ten sposób traktowane ani wykorzystywane. Więcej informacji na ten temat znajdziesz w naszym Regulaminie.