PROTECTED SOURCE SCRIPT
Daily SMA200 Distance - Percentile Zones
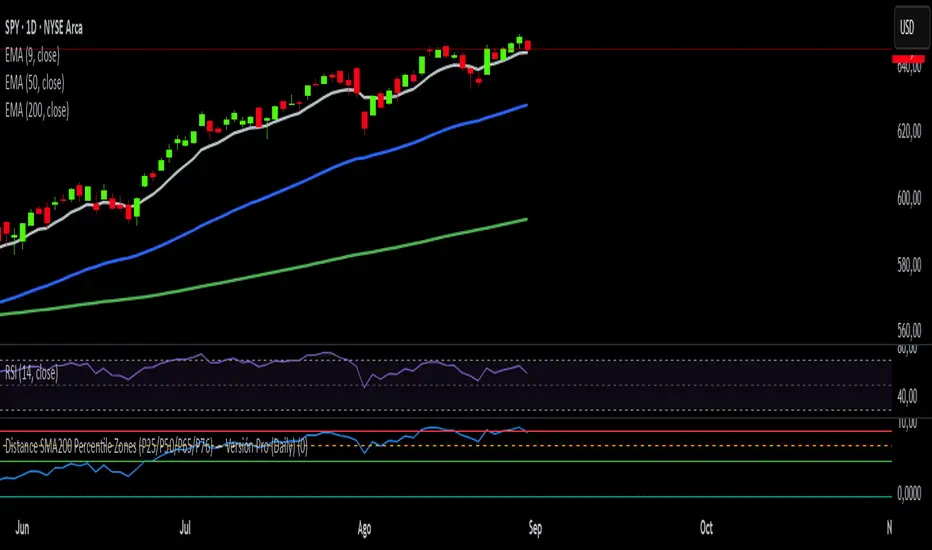
The Daily SMA200 Distance – Percentile Zones indicator measures the percentage distance of price relative to the 200-day Simple Moving Average (SMA200) and classifies it into historical percentile zones.
This tool helps identify the context of an asset in relation to its medium- to long-term trend:
Cheap Zone (< P25): price at historically low levels relative to the SMA200.
Value Zone (P25–P50): neutral range, where price trades around its medium-term average.
Acceptable Zone (P50–P65): moderately high levels, still reasonable within an uptrend.
Not Recommended Zone (P65–P76): overextended territory with rising correction risk.
Very Expensive Zone (≥ P76): extreme levels, historically linked to overvaluation and potential market tops.
Percentile calculations update dynamically with each new daily candle, providing a robust and objective statistical perspective for swing trading and portfolio management decisions.
Skrypt chroniony
Ten skrypt został opublikowany jako zamknięty kod źródłowy. Możesz jednak używać go swobodnie i bez żadnych ograniczeń – więcej informacji tutaj.
Wyłączenie odpowiedzialności
Informacje i publikacje przygotowane przez TradingView lub jego użytkowników, prezentowane na tej stronie, nie stanowią rekomendacji ani porad handlowych, inwestycyjnych i finansowych i nie powinny być w ten sposób traktowane ani wykorzystywane. Więcej informacji na ten temat znajdziesz w naszym Regulaminie.