OPEN-SOURCE SCRIPT
% Above 50 DMA
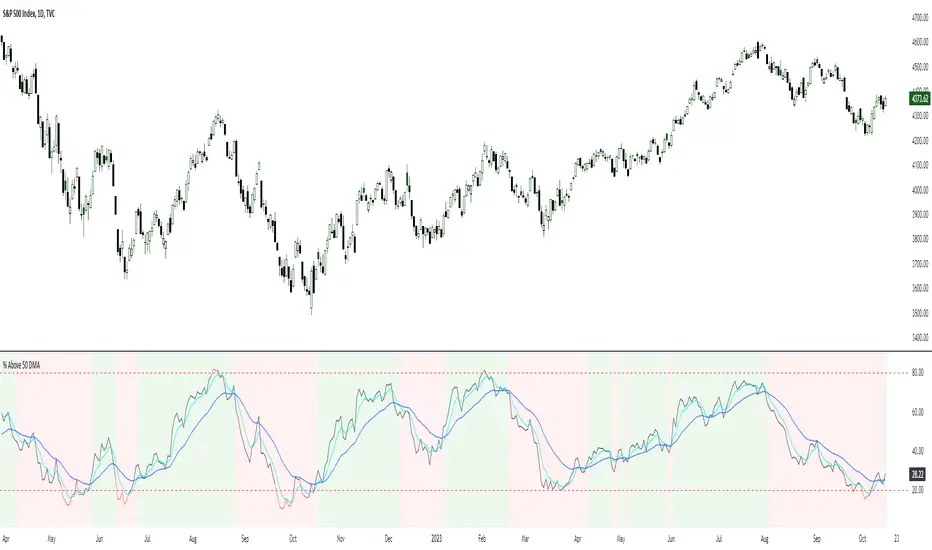
Displays the % of stocks above their 50 day average and the 5 and 20 ema of the indicator. Often the market will trend up when the 5ema is above the 20ema for this indicator, or down when vice versa. The 20% and 80% levels are plotted to show potentially oversold or overbought markets. Select NYSE or Nasdaq in the settings.
Skrypt open-source
W zgodzie z duchem TradingView twórca tego skryptu udostępnił go jako open-source, aby użytkownicy mogli przejrzeć i zweryfikować jego działanie. Ukłony dla autora. Korzystanie jest bezpłatne, jednak ponowna publikacja kodu podlega naszym Zasadom serwisu.
Wyłączenie odpowiedzialności
Informacje i publikacje nie stanowią i nie powinny być traktowane jako porady finansowe, inwestycyjne, tradingowe ani jakiekolwiek inne rekomendacje dostarczane lub zatwierdzone przez TradingView. Więcej informacji znajduje się w Warunkach użytkowania.