PROTECTED SOURCE SCRIPT
Quantum Trend Indicator
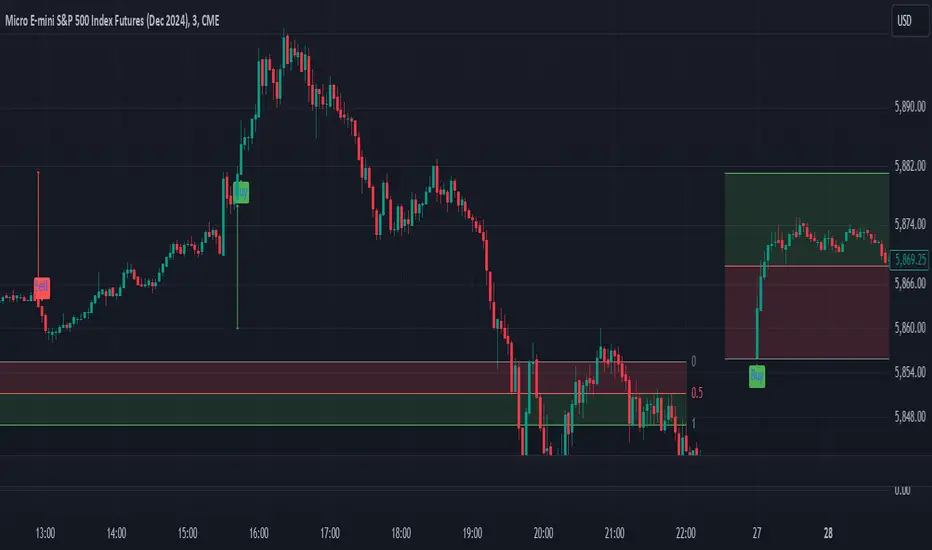
This algorithm, named "Quantum Trend Indicator," is designed to generate trading signals based on a mix of indicators like RSI, Stochastic RSI, volatility (using standard deviation), and a Z-score filter. Here’s a breakdown of the components:
1. RSI Calculation:
2. Stochastic RSI:
3. Volatility Calculation:
4. Z-Score Calculation:
5. Filtering Stages:
6. Signal Generation:
Suggested Optimal Settings for S&P 500 Index on 3-Minute Timeframe
1. RSI Calculation:
- Calculates the Relative Strength Index (RSI) of the closing price using a specified length (rsiLength).
- RSI is a momentum oscillator that measures the speed and change of price movements.
2. Stochastic RSI:
- A stochastic RSI is calculated from the RSI values, essentially a second layer of smoothing that is often more sensitive to price changes.
- The code uses %K (fast) and %D (slow) components to smooth the Stochastic RSI, providing pivot signals based on crossovers:
*stochRsiPivotUp: Signals a potential reversal to the upside.
*stochRsiPivotDown: Signals a potential reversal to the downside.
3. Volatility Calculation:
- Calculates volatility using the standard deviation of the closing prices over a set volatilityLength.
- Standard deviation measures how spread out the prices are, giving an idea of the current price volatility.
4. Z-Score Calculation:
- Computes the Z-score of the closing prices to see how far current prices are from their mean, normalized by volatility.
- The Z-score helps identify rare price movements, indicating potential reversals when the value is extreme (either high or low).
5. Filtering Stages:
- Stage 1: Uses Stochastic RSI pivots to detect initial reversal signals.
- Stage 2: Uses volatility and the Z-score to ensure the signal is generated during high-volatility periods with significant price movements.
- signalUp: Generated when conditions indicate an upward reversal.
- signalDown: Generated for a potential downward reversal.
6. Signal Generation:
- If all conditions for signalUp or signalDown are met, a "Buy" or "Sell" signal is shown on the chart.
Suggested Optimal Settings for S&P 500 Index on 3-Minute Timeframe
- rsiLength (RSI Length):
- Optimal Range: 8 to 14.
- Recommendation: A shorter rsiLength (8–10) would make RSI more responsive on a 3-minute timeframe for S&P 500, helping to catch fast price movements.
- stochRsiLength (Stochastic RSI Length):
- Optimal Range: 8 to 14.
- Recommendation: A length similar to the rsiLength (e.g., 8 or 10) will keep Stochastic RSI sensitive enough for shorter timeframes like 3 minutes.
- stochRsiK (%K Period for Stochastic RSI):
- Optimal Range: 3 to 5.
- Recommendation: stochRsiK around 3 provides smoother Stochastic RSI values, with less noise on short timeframes.
- stochRsiD (%D Period for Stochastic RSI):
- Optimal Range: 3 to 5.
- Recommendation: Use a period around 3 for stochRsiD to complement the sensitivity of %K while still filtering out excessive noise.
- volatilityLength (Volatility Calculation Length):
- Optimal Range: 14 to 20.
- Recommendation: Around 14 to 16 works well on shorter timeframes, as it captures recent volatility trends without excessive lag.
- sigmaMultiplier (Sigma Multiplier for Volatility Filter):
- Optimal Range: 1.5 to 2.5.
- Recommendation: A multiplier of around 1.8 to 2.2 strikes a balance, highlighting significant moves without over-filtering.
- zScoreThreshold (Threshold for Signal Validity):
- Optimal Range: 1.5 to 2.0.
- Recommendation: A threshold of around 1.8 generally provides enough sensitivity while filtering out minor price swings, especially on a high-liquidity asset like the S&P 500.
Skrypt chroniony
Ten skrypt został opublikowany jako zamknięty kod źródłowy. Można z tego korzystać swobodnie i bez żadnych ograniczeń — więcej informacji znajduje się tutaj.
Wyłączenie odpowiedzialności
Informacje i publikacje nie stanowią i nie powinny być traktowane jako porady finansowe, inwestycyjne, tradingowe ani jakiekolwiek inne rekomendacje dostarczane lub zatwierdzone przez TradingView. Więcej informacji znajduje się w Warunkach użytkowania.