OPEN-SOURCE SCRIPT
Zaktualizowano Advanced RSI Helper

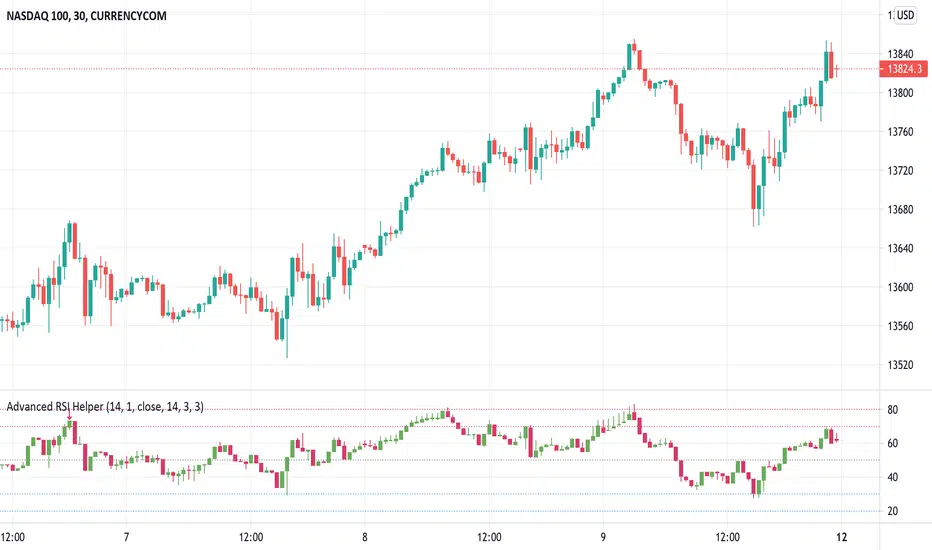
Here is Advanced RSI Helper. An advanced RSI represented in a candle type chart. It contains a Stochastic and a Pivot Detector (High-Low) and RSI divergences.
It also contains a Filter which you can configure the upper, lower zone to colorize the bars on the chart only when you are overbought or oversold, when you are in range the bars appear "transparent".
You also have the option of placing alerts for divergences or when the rsi exceeds the upper zone 1 / 2 or lower zone 1 / 2.
if you encounter any bugs do not hesitate to let me know in the comment area. The same goes for your suggestions.
Cheers and remember, risk management is the most important!
Informacje o Wersji
-Bug fix.Informacje o Wersji
-Minor improvement.Informacje o Wersji
-Minor improvements.Informacje o Wersji
-Displaced the "RSI Filter Bar Color" into my other indicator "Rain On Me PRO 1/3" cause it was making conflict with it when used together.Informacje o Wersji
-Less "flashy" Bar Color.Informacje o Wersji
-Minor improvements.Informacje o Wersji
-New option added "Show RSI Meter" in setting. That will help newbie to understand RSI fundamentals and can show you easily the RSI state in one look :)Thank to all for your supports!
Informacje o Wersji
-Code cleaning and minor improvements.Informacje o Wersji
-Minor improvement.Informacje o Wersji
-Removed "RSI Meter" cause it need display improvement.Skrypt open-source
W zgodzie z duchem TradingView twórca tego skryptu udostępnił go jako open-source, aby użytkownicy mogli przejrzeć i zweryfikować jego działanie. Ukłony dla autora. Korzystanie jest bezpłatne, jednak ponowna publikacja kodu podlega naszym Zasadom serwisu.
Telegram: t.me/+erb2pUEsHc43NmRk
E-mail: support@ricksimpsontrading.com
E-mail: support@ricksimpsontrading.com
Wyłączenie odpowiedzialności
Informacje i publikacje nie stanowią i nie powinny być traktowane jako porady finansowe, inwestycyjne, tradingowe ani jakiekolwiek inne rekomendacje dostarczane lub zatwierdzone przez TradingView. Więcej informacji znajduje się w Warunkach użytkowania.
Skrypt open-source
W zgodzie z duchem TradingView twórca tego skryptu udostępnił go jako open-source, aby użytkownicy mogli przejrzeć i zweryfikować jego działanie. Ukłony dla autora. Korzystanie jest bezpłatne, jednak ponowna publikacja kodu podlega naszym Zasadom serwisu.
Telegram: t.me/+erb2pUEsHc43NmRk
E-mail: support@ricksimpsontrading.com
E-mail: support@ricksimpsontrading.com
Wyłączenie odpowiedzialności
Informacje i publikacje nie stanowią i nie powinny być traktowane jako porady finansowe, inwestycyjne, tradingowe ani jakiekolwiek inne rekomendacje dostarczane lub zatwierdzone przez TradingView. Więcej informacji znajduje się w Warunkach użytkowania.