OPEN-SOURCE SCRIPT
Point and Figure on Candlestick Chart
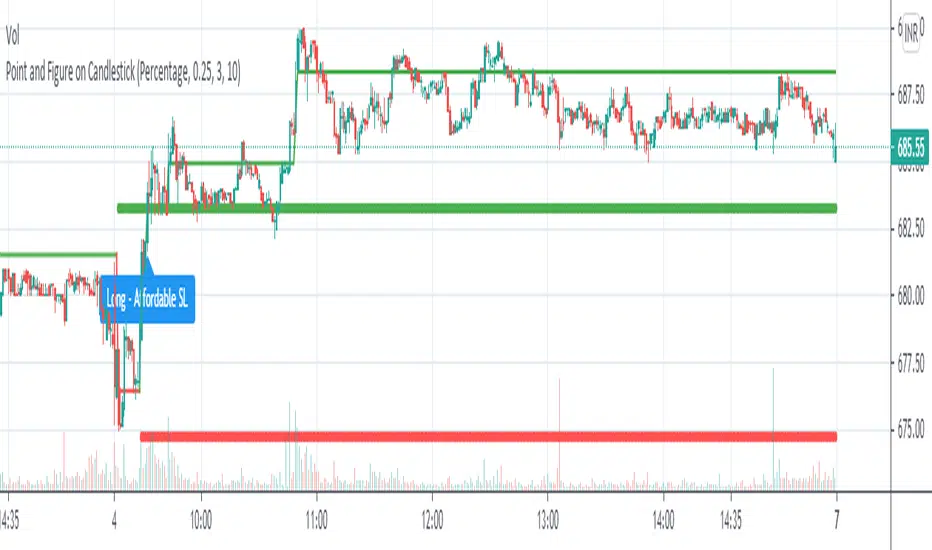
Live plotting of Point and Figure chart on a candlestick chart. With its own construction engine, it plot "X" and "O" column using a line chart. It plots the "X" column with green color and the "O" column with red color. Color of the line chart change from green to red when the column reversed from "X" to "O". It plot "Double Top Buy" and "Double Bottom Sell" level which help to do candlestick pattern analysis along with Point and Figure chart. Works on all timeframes with given parameters.
Options :
Box Size Assignment Method : Select a method to construct Point and Figure chart. There are two options "Fix" and "Percentage". The default value is "Percentage".
Box Size : The size of box. Minimum price movement to plot a new box. Smaller box size shows greater price movement and Bigger box size shows more filtered price movement compare to smaller box size. The default value is "0.25%"
Reversal Size : Minimum boxes required for column reversal. The default value is "3".
Stoploss Size In Box : To get affordable trade give the number of boxes for stop loss.
Skrypt open-source
W zgodzie z duchem TradingView twórca tego skryptu udostępnił go jako open-source, aby użytkownicy mogli przejrzeć i zweryfikować jego działanie. Ukłony dla autora. Korzystanie jest bezpłatne, jednak ponowna publikacja kodu podlega naszym Zasadom serwisu.
Wyłączenie odpowiedzialności
Informacje i publikacje nie stanowią i nie powinny być traktowane jako porady finansowe, inwestycyjne, tradingowe ani jakiekolwiek inne rekomendacje dostarczane lub zatwierdzone przez TradingView. Więcej informacji znajduje się w Warunkach użytkowania.