OPEN-SOURCE SCRIPT
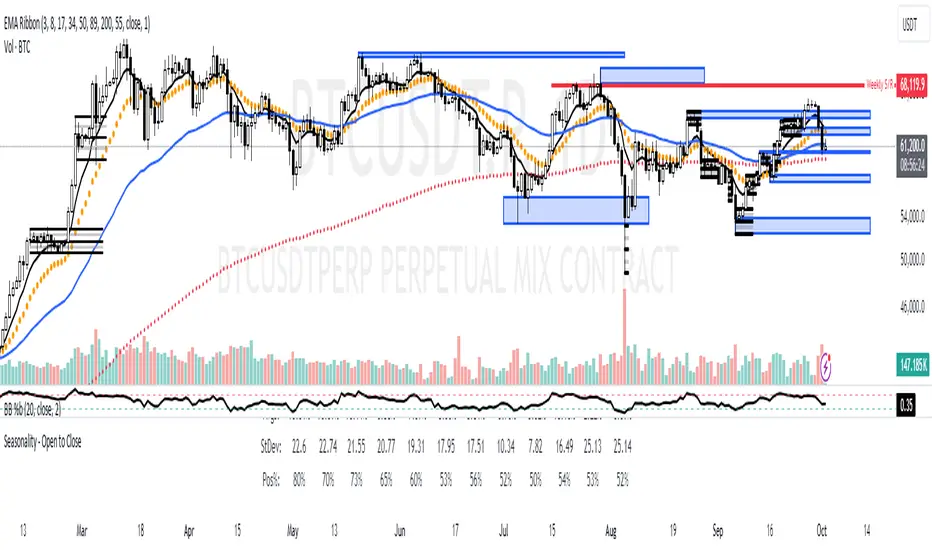
2024 - Seasonality - Open to Close

Script Description:
This Pine Script is designed to visualise **seasonality** in the financial markets by calculating the **open-to-close percentage change** for each month of a selected asset. It creates a **heatmap** table to display the monthly performance over multiple years. The script provides detailed statistical summaries, including:
- **Average monthly percentage changes**
- **Standard deviation** of the changes
- **Percentage of months with positive returns**
The script also allows users to adjust colour intensities for positive and negative values, specify which year to start from, and skip specific months. Key metrics such as averages, standard deviations, and percentages of positive months can be toggled on or off based on user preferences. The result is a clear, visual representation of how an asset typically performs month by month, aiding in seasonality analysis.
Skrypt open-source
W zgodzie z duchem TradingView twórca tego skryptu udostępnił go jako open-source, aby użytkownicy mogli przejrzeć i zweryfikować jego działanie. Ukłony dla autora. Korzystanie jest bezpłatne, jednak ponowna publikacja kodu podlega naszym Zasadom serwisu.
Wyłączenie odpowiedzialności
Informacje i publikacje nie stanowią i nie powinny być traktowane jako porady finansowe, inwestycyjne, tradingowe ani jakiekolwiek inne rekomendacje dostarczane lub zatwierdzone przez TradingView. Więcej informacji znajduje się w Warunkach użytkowania.