Jackrabbit.modulus.RangeHunter

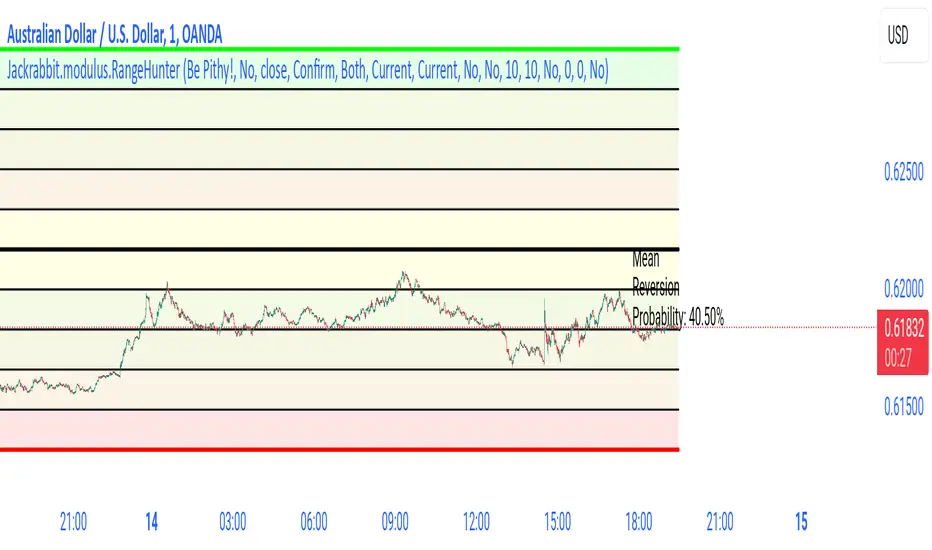
Range Hunter works by finding the highest boundary and the lowest boundary of a time frame. From there, it creates a median by which the market should fluctuate as signs of its health. When the price stays in the upper/lower ranges for too long, the market is considered "unhealthy". Price action should cycle around the median routinele for a healthy market.
From the upper range to the lower range is divided into 10% segments.
There are five segments above the median where price action is considered over valued or oversold.
There are five segments below the median where price action is considered undervalued or oversold.
Buying and selling is divided into 10 boundaries. The 10th boundary for purchasing starts at the lowest range and goes downwards as price climbs. The 10th boundary for selling is where the price is the highest range and goes downwards as price drops.
Buys take place when price action drops bwelow and the climbs above the desire boundary. Sells behave the exact opposite.
The user can configure the boundary that buying and selling takes place independently and supports all elements/settings of the Jackrabbit modulus framework except confirmation bias. If confirmation bias is desired then this module needs to be loaded twice.
The Jackrabbit modulus framework is a plug in play paradigm built to operate through TradingView's indicator on indicatior (IoI) functionality. As such, this script receives a signal line from the previous script in the IoI chain, and evaluates the buy/sell signals appropriate to the current analysis.
Mean reversion probability is a measure that captures how likely it is for a price to return to its average level after moving away from it. Think of it like a rubber band—when stretched too far, it tends to snap back to its original position. This statistic helps indicate whether a price is likely to "revert to the norm" or continue to drift further away, giving a sense of balance or tension in the market.
Skrypt tylko na zaproszenie
Dostęp do tego skryptu mają wyłącznie użytkownicy zatwierdzeni przez autora. Aby z niego korzystać, należy poprosić o zgodę i ją uzyskać. Zgoda jest zazwyczaj udzielana po dokonaniu płatności. Więcej informacji można znaleźć w instrukcjach autora poniżej lub kontaktując się bezpośrednio z RobertD7723.
TradingView NIE zaleca płacenia za skrypt ani korzystania z niego, jeśli nie ma pełnego zaufania do jego autora i nie rozumie się zasad jego działania. Można również znaleźć darmowe, otwartoźródłowe alternatywy w skryptach społeczności.
Instrukcje autora
patreon.com/RD3277
Wyłączenie odpowiedzialności
Skrypt tylko na zaproszenie
Dostęp do tego skryptu mają wyłącznie użytkownicy zatwierdzeni przez autora. Aby z niego korzystać, należy poprosić o zgodę i ją uzyskać. Zgoda jest zazwyczaj udzielana po dokonaniu płatności. Więcej informacji można znaleźć w instrukcjach autora poniżej lub kontaktując się bezpośrednio z RobertD7723.
TradingView NIE zaleca płacenia za skrypt ani korzystania z niego, jeśli nie ma pełnego zaufania do jego autora i nie rozumie się zasad jego działania. Można również znaleźć darmowe, otwartoźródłowe alternatywy w skryptach społeczności.
Instrukcje autora
patreon.com/RD3277