PROTECTED SOURCE SCRIPT
Zaktualizowano Daily SMA200 Distance – Percentile Zones PRO
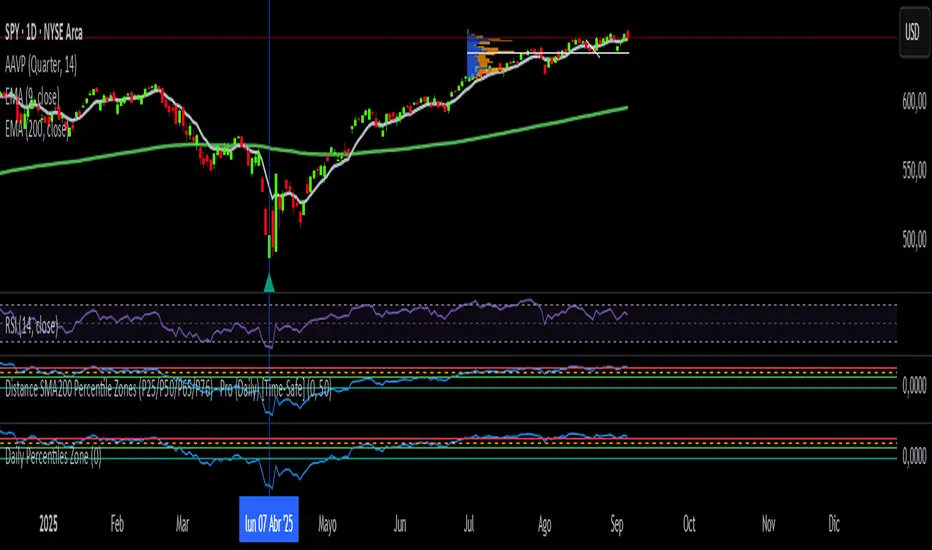
Indicator Description — Weekly/Daily SMA200 Distance – Percentile Zones
The SMA200 Distance – Percentile Zones indicator measures the percentage distance between the price and its 200-period Simple Moving Average (SMA200), and classifies it into historical percentile zones.
This tool helps traders and investors understand the market context of an asset relative to its long-term trend:
Cheap Zone (< P25): price at historically low levels compared to SMA200.
Value Zone (P25–P50): neutral range, where price trades around its long-term average.
Acceptable Zone (P50–P65): moderately high levels, still reasonable within an uptrend.
Not Recommended Zone (P65–P76): overextended territory, with increasing correction risk.
Very Expensive Zone (≥ P76): extreme levels, historically linked to overvaluation and potential market tops.
Percentiles are calculated dynamically from the entire historical dataset (since the SMA200 becomes available), providing a robust and objective statistical framework for decision-making.
✅ In summary:
This indicator works as a quantitative valuation map — showing whether the asset is cheap, fairly valued, acceptable, risky, or very expensive relative to its historical behavior against the SMA200.
Informacje o Wersji
Daily Percentiles ZoneShows the distance of price from the 200-day EMA and classifies it into historical percentiles (P25, P50, P65, P76). Helps identify whether the asset is cheap, fair value, acceptable, risky, or very expensive compared to its long-term daily trend.
Skrypt chroniony
Ten skrypt został opublikowany jako zamknięty kod źródłowy. Można z tego korzystać swobodnie i bez żadnych ograniczeń — więcej informacji znajduje się tutaj.
Wyłączenie odpowiedzialności
Informacje i publikacje nie stanowią i nie powinny być traktowane jako porady finansowe, inwestycyjne, tradingowe ani jakiekolwiek inne rekomendacje dostarczane lub zatwierdzone przez TradingView. Więcej informacji znajduje się w Warunkach użytkowania.