PROTECTED SOURCE SCRIPT
Nifty VWAP

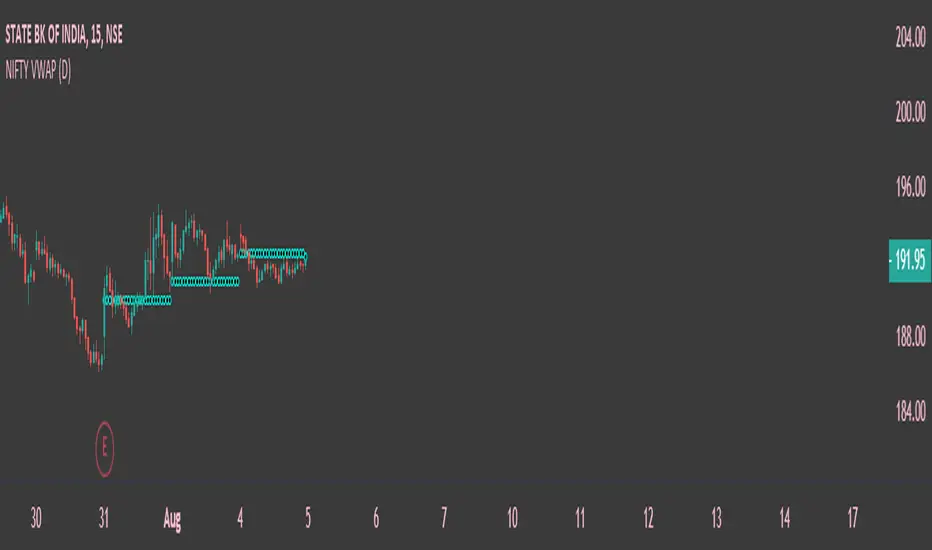
This indicator is based on Indian Indices Nifty and Nifty 50 Stocks . Combination of breadth volumes of Niifty50 stocks to get Nifty Volume , can be used only Nifty50 Index and stocks . This indicator tells you the trend of the index or stocks. If the price is above the Volume weighted average price line its considers as Bullish Trend and if the price is below the Volume weighted average price line its considered as Bearish Trend. Default resolution is Set as Day , can be customized according to ones choice . Hope you guys will like it .
Skrypt chroniony
Ten skrypt został opublikowany jako zamknięty kod źródłowy. Można z tego korzystać swobodnie i bez żadnych ograniczeń — więcej informacji znajduje się tutaj.
Wyłączenie odpowiedzialności
Informacje i publikacje nie stanowią i nie powinny być traktowane jako porady finansowe, inwestycyjne, tradingowe ani jakiekolwiek inne rekomendacje dostarczane lub zatwierdzone przez TradingView. Więcej informacji znajduje się w Warunkach użytkowania.