OPEN-SOURCE SCRIPT
Persistent Homology Based Trend Strength Oscillator
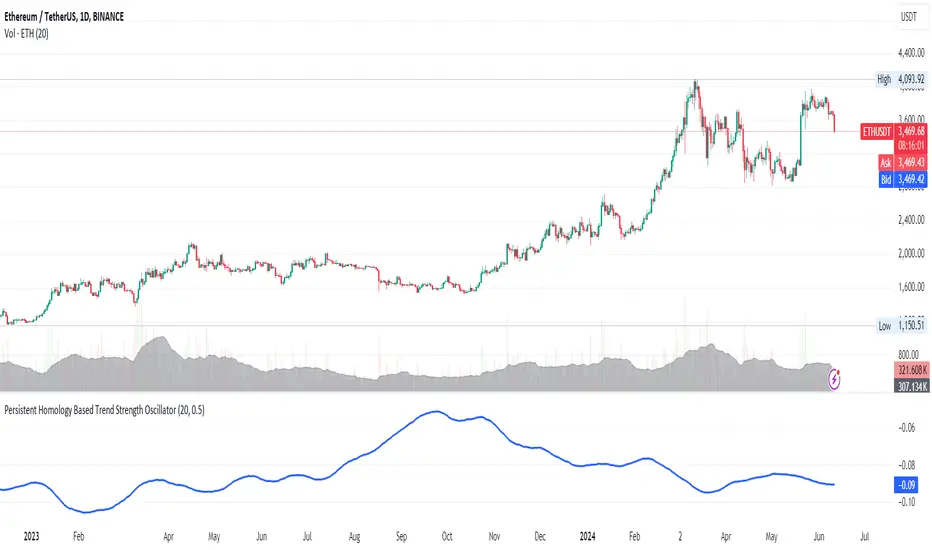
Persistent Homology Based Trend Strength Oscillator
The Persistent Homology Based Trend Strength Oscillator is a unique and powerful tool designed to measure the persistence of market trends over a specified rolling window. By applying the principles of persistent homology, this indicator provides traders with valuable insights into the strength and stability of uptrends and downtrends, helping to inform better trading decisions.
What Makes This Indicator Original?
This indicator's originality lies in its application of persistent homology, a method from topological data analysis, to financial markets. Persistent homology examines the shape and features of data across multiple scales, identifying patterns that persist as the scale changes. By adapting this concept, the oscillator tracks the persistence of uptrends and downtrends in price data, offering a novel approach to trend analysis.
Concepts Underlying the Calculations:
How It Works:
How Traders Can Use It:
Example Usage:
The Persistent Homology Based Trend Strength Oscillator is a unique and powerful tool designed to measure the persistence of market trends over a specified rolling window. By applying the principles of persistent homology, this indicator provides traders with valuable insights into the strength and stability of uptrends and downtrends, helping to inform better trading decisions.
What Makes This Indicator Original?
This indicator's originality lies in its application of persistent homology, a method from topological data analysis, to financial markets. Persistent homology examines the shape and features of data across multiple scales, identifying patterns that persist as the scale changes. By adapting this concept, the oscillator tracks the persistence of uptrends and downtrends in price data, offering a novel approach to trend analysis.
Concepts Underlying the Calculations:
- Persistent Homology: This method identifies features such as clusters, holes, and voids that persist as the scale changes. In the context of this indicator, it tracks the duration and stability of price trends.
- Rolling Window Analysis: The oscillator uses a specified window size to calculate the average length of uptrends and downtrends, providing a dynamic view of trend persistence over time.
- Threshold-Based Trend Identification: It differentiates between uptrends and downtrends based on specified thresholds for price changes, ensuring precision in trend detection.
How It Works:
- The oscillator monitors consecutive changes in closing prices to identify uptrends and downtrends.
- An uptrend is detected when the closing price increase exceeds a specified positive threshold.
- A downtrend is detected when the closing price decrease exceeds a specified negative threshold.
- The lengths of these trends are recorded and averaged over the chosen window size.
- The Trend Persistence Index is calculated as the difference between the average uptrend length and the average downtrend length, providing a measure of trend persistence.
How Traders Can Use It:
- Identify Trend Strength: The Trend Persistence Index offers a clear measure of the strength and stability of uptrends and downtrends. A higher value indicates stronger and more persistent uptrends, while a lower value suggests stronger and more persistent downtrends.
- Spot Trend Reversals: Significant shifts in the Trend Persistence Index can signal potential trend reversals. For instance, a transition from positive to negative values might indicate a shift from an uptrend to a downtrend.
- Confirm Trends: Use the Trend Persistence Index alongside other technical indicators to confirm the strength and duration of trends, enhancing the accuracy of your trading signals.
- Manage Risk: Understanding trend persistence can help traders manage risk by identifying periods of high trend stability versus periods of potential volatility. This can be crucial for timing entries and exits.
Example Usage:
- Default Settings: Start with the default settings to get a feel for the oscillator’s behavior. Observe how the Trend Persistence Index reacts to different market conditions.
- Adjust Thresholds: Fine-tune the positive and negative thresholds based on the asset's volatility to improve trend detection accuracy.
- Combine with Other Indicators: Use the Persistent Homology Based Trend Strength Oscillator in conjunction with other technical indicators such as moving averages, RSI, or MACD for a comprehensive analysis.
- Backtesting: Conduct backtesting to see how the oscillator would have performed in past market conditions, helping you to refine your trading strategy.
Skrypt open-source
W zgodzie z duchem TradingView twórca tego skryptu udostępnił go jako open-source, aby użytkownicy mogli przejrzeć i zweryfikować jego działanie. Ukłony dla autora. Korzystanie jest bezpłatne, jednak ponowna publikacja kodu podlega naszym Zasadom serwisu.
Wyłączenie odpowiedzialności
Informacje i publikacje nie stanowią i nie powinny być traktowane jako porady finansowe, inwestycyjne, tradingowe ani jakiekolwiek inne rekomendacje dostarczane lub zatwierdzone przez TradingView. Więcej informacji znajduje się w Warunkach użytkowania.