OPEN-SOURCE SCRIPT
Candle Range Theory
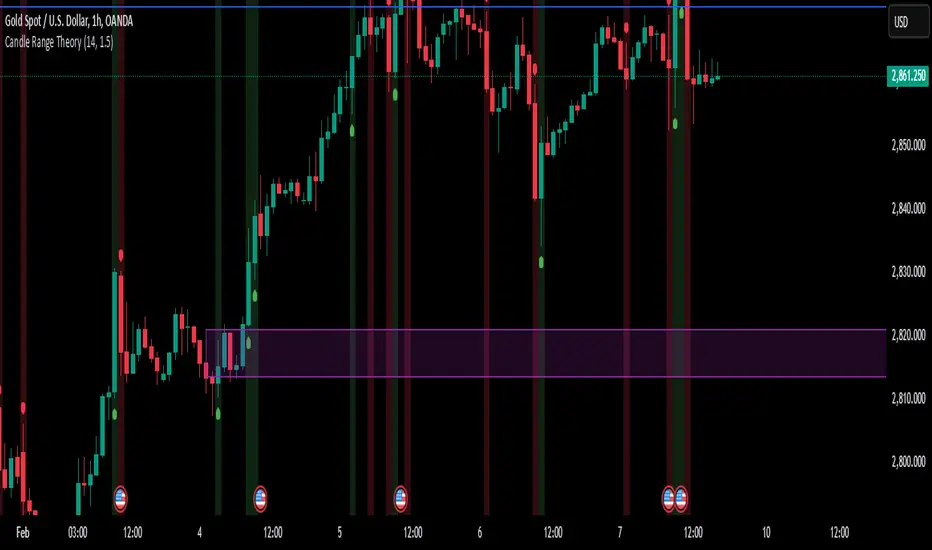
Candle Range Analysis:
Calculates the true range of each candle
Shows a 14-period SMA of the range (adjustable)
Dynamic bands based on standard deviation
Visual Components:
Colored histogram showing range deviations from mean
Signal line for oscillator smoothing
Expansion/contraction zones marked with dotted lines
Arrow markers for extreme range conditions
Key Functionality:
Identifies range expansion/contraction relative to historical volatility
Shows normalized range oscillator (-100% to +100% scale)
Includes visual and audio alerts for extreme range conditions
Customizable parameters for sensitivity and smoothing
Interpretation:
Red zones indicate above-average volatility/expansion
Green zones indicate below-average volatility/contraction
Crossings above/below zero line show range expansion/contraction
Signal line crossover system potential
Skrypt open-source
W zgodzie z duchem TradingView twórca tego skryptu udostępnił go jako open-source, aby użytkownicy mogli przejrzeć i zweryfikować jego działanie. Ukłony dla autora. Korzystanie jest bezpłatne, jednak ponowna publikacja kodu podlega naszym Zasadom serwisu.
Wyłączenie odpowiedzialności
Informacje i publikacje nie stanowią i nie powinny być traktowane jako porady finansowe, inwestycyjne, tradingowe ani jakiekolwiek inne rekomendacje dostarczane lub zatwierdzone przez TradingView. Więcej informacji znajduje się w Warunkach użytkowania.