PROTECTED SOURCE SCRIPT
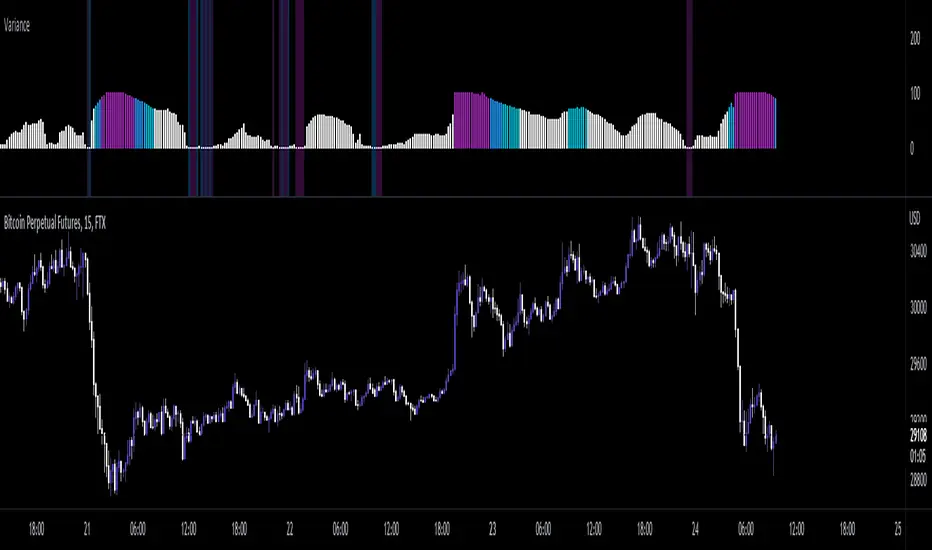
Variance Percentile
As repeated from my Variance Z-Score Script:
"Variance is a measure of dispersion, simply put, it is measuring how distant data is from it's mean(average). This indicator allows you to see when variance is increasing or decreasing, as well as when it is at an extreme value. Thru this, you can get a more accurate description of risk. When variance is increasing/high, you know to expect larger moves, as data(price) is far and getting farther from the mean. and when it is low/decreasing, you know that price movement is more likely to be less volatile due to data clustering closer to the mean, ie ; smaller values."
With Variance Percentile, we apply a percent rank function to get some statistical context from raw variance data. Used the same as my pervious Historical volatility indicator, it shows what % of historical data was less than or equal to the current value, allowing us to find point where variance is statistically likely to increase, as well as when it is at an extreme.
Recommended to paired with Historical volatility or Volatility Z-score to assist in establishing a more accurate estimation of market volatility
Skrypt chroniony
Ten skrypt został opublikowany jako zamknięty kod źródłowy. Można z tego korzystać swobodnie i bez żadnych ograniczeń — więcej informacji znajduje się tutaj.
Wyłączenie odpowiedzialności
Informacje i publikacje nie stanowią i nie powinny być traktowane jako porady finansowe, inwestycyjne, tradingowe ani jakiekolwiek inne rekomendacje dostarczane lub zatwierdzone przez TradingView. Więcej informacji znajduje się w Warunkach użytkowania.