PROTECTED SOURCE SCRIPT
Choppy Market Meter x SmartBlackGirl
How It Works
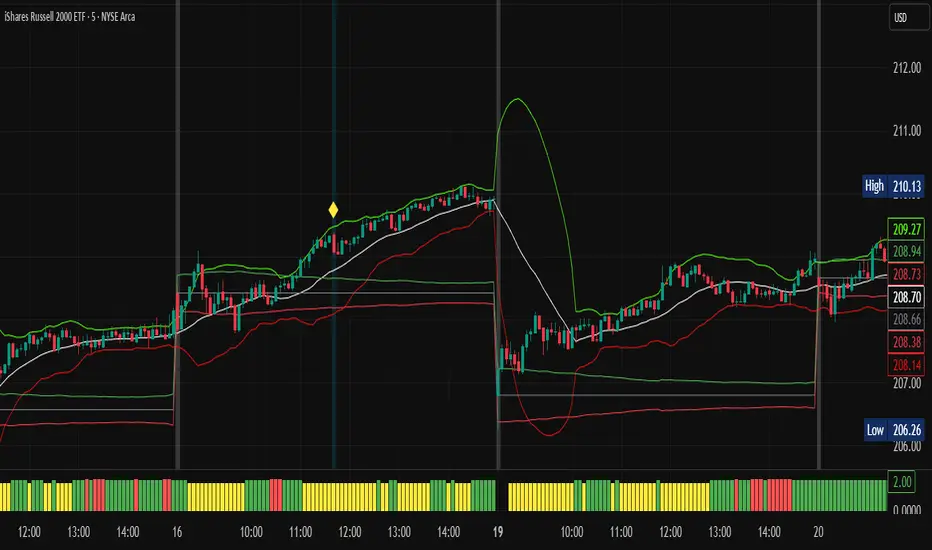
The indicator measures compression or indecision by analyzing Bollinger Band Width (BBW), volume, and price behavior. It plots a bar graph or colored meter under your chart showing:
🔴 Red (Chop Zone) – Market is consolidating or stuck in a tight range. Avoid trading.
🟡 Yellow (Transition) – Volatility may be increasing. Watch for breakouts.
🟢 Green (Breakout Zone) – Volatility has expanded, and the market is likely trending. This is the best time to trade momentum-based setups.
✅ Best Times to Trade with the Chop Meter
Wait for the bar to turn green or exit the red zone.
Confirm with other signals like:
Breakouts from Bollinger Band squeezes
Volume surge
Directional bias (e.g., from ORB box or higher timeframe trend)
Avoid trades during red chop bars, as breakouts often fail and get reversed.
Use the Chop Meter as a filter, not a signal. Combine it with your breakout or momentum strategy (e.g., BB Squeeze, ORB Box) to increase win rate and avoid trading noise.
Skrypt chroniony
Ten skrypt został opublikowany jako zamknięty kod źródłowy. Możesz jednak używać go swobodnie i bez żadnych ograniczeń – więcej informacji tutaj.
Wyłączenie odpowiedzialności
Informacje i publikacje przygotowane przez TradingView lub jego użytkowników, prezentowane na tej stronie, nie stanowią rekomendacji ani porad handlowych, inwestycyjnych i finansowych i nie powinny być w ten sposób traktowane ani wykorzystywane. Więcej informacji na ten temat znajdziesz w naszym Regulaminie.